Fig. 8.
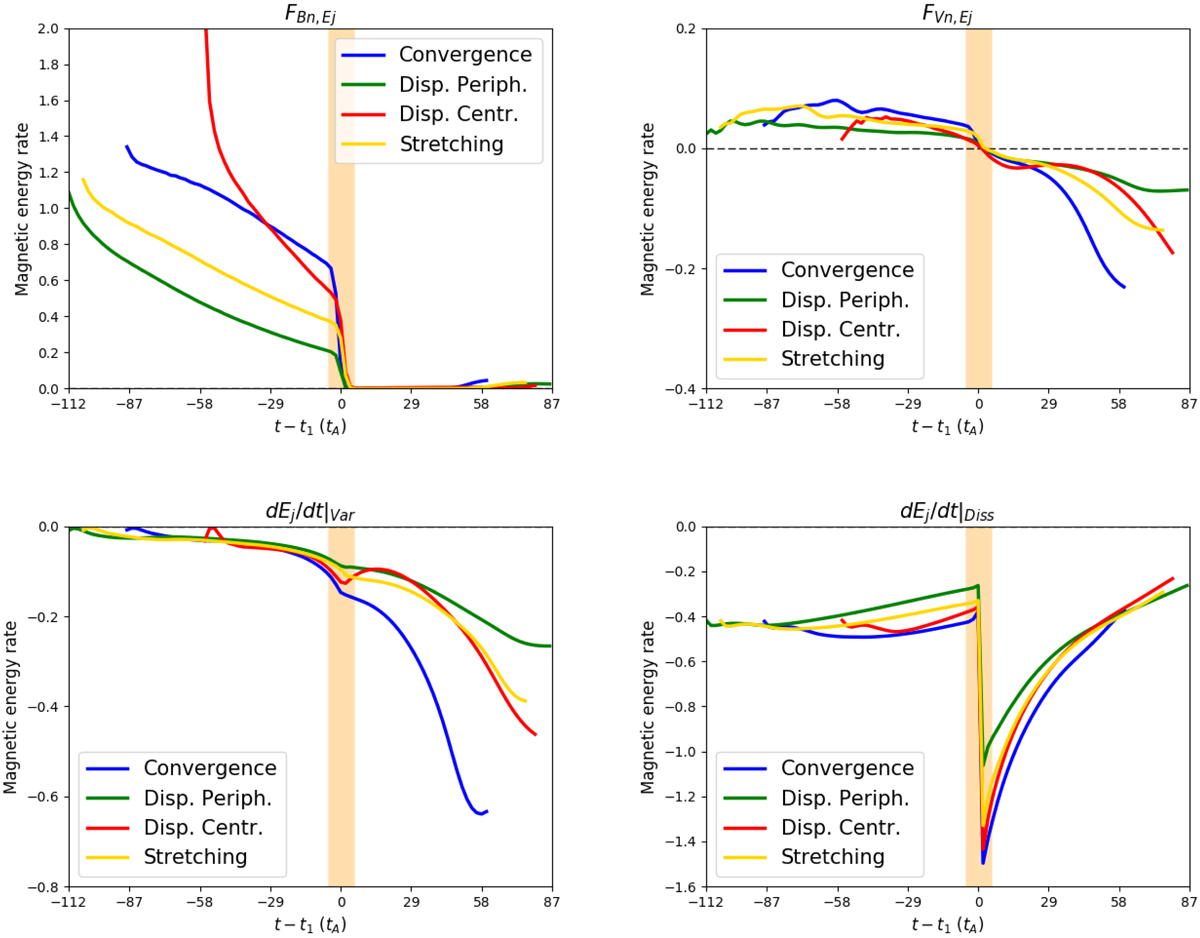
Time evolution of the different gauge-invariant terms of dEj/dt: FBn, Ej (top right panel, Eq. (51)), FVn, Ej (top left panel, Eq. (52)), dEj/dt|Var (bottom left panel, Eq. (50)), and dEj/dt|Diss (bottom right panel, Eq. (49)). The different colors present one simulation: dispersion central (red line), dispersion peripheral (green line), stretching (yellow line), and convergence (blue line). The yellow band corresponds to the onset phase of the eruption.
Current usage metrics show cumulative count of Article Views (full-text article views including HTML views, PDF and ePub downloads, according to the available data) and Abstracts Views on Vision4Press platform.
Data correspond to usage on the plateform after 2015. The current usage metrics is available 48-96 hours after online publication and is updated daily on week days.
Initial download of the metrics may take a while.