Fig. 4.
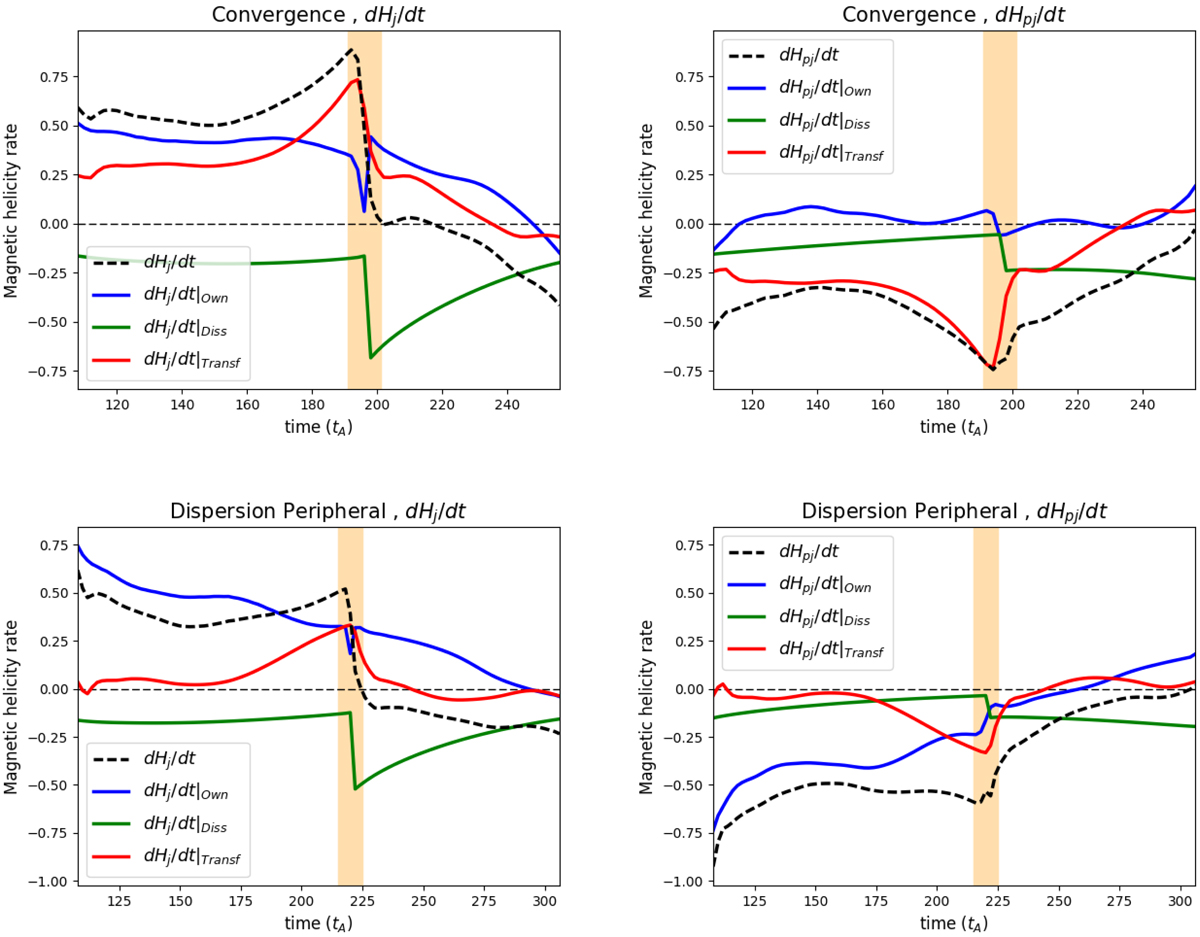
Time evolution of the helicity variation rates, dHj/dt and dHpj/dt (dashed black curves; Eqs. (8) and (19)), of the helicity transfer term, dHj/dt|Transf and dHpj/dt|Transf (solid red curves; Eqs. (10) and (21)), of the own terms, dHj/dt|Own and dHpj/dt|Own (solid blue curves; Eqs. (18) and (29)), and of the dissipation terms, dHj/dt|Diss and dHpj/dt|Diss (solid green curves; Eqs. (9) and (20)) for the convergence simulation (top panels) and for the dispersion peripheral simulation (bottom panels). Left and right panels: evolution of the current carrying helicity, Hj, and volume-threading helicity Hpj, respectively.
Current usage metrics show cumulative count of Article Views (full-text article views including HTML views, PDF and ePub downloads, according to the available data) and Abstracts Views on Vision4Press platform.
Data correspond to usage on the plateform after 2015. The current usage metrics is available 48-96 hours after online publication and is updated daily on week days.
Initial download of the metrics may take a while.