Fig. 3.
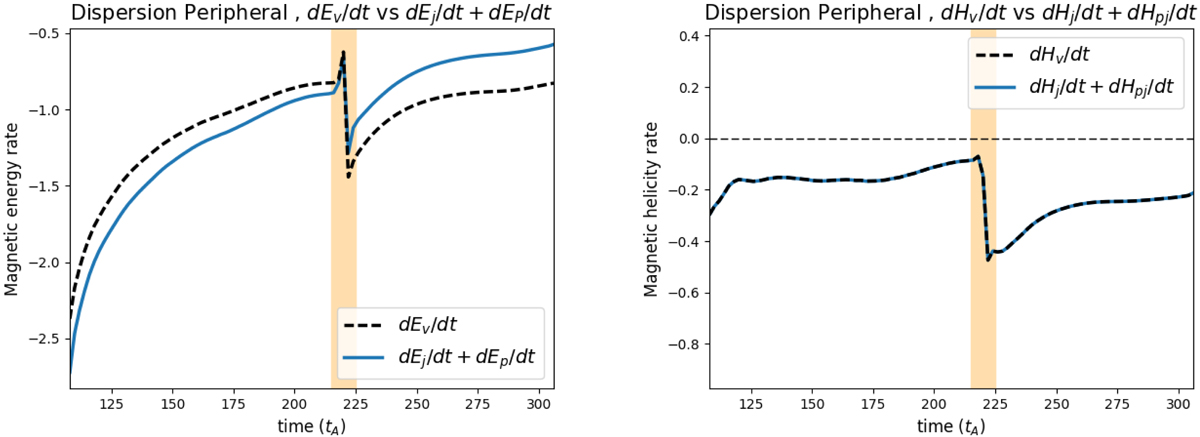
Left panel: time evolution of the instantaneous time-variation, dEv/dt (dashed black curves, Eq. (37)), and of the sum, dEj/dt + dEp/dt (continuous blue curves, Eqs. (8) and (19)) for the dispersion peripheral run. Right panel: time evolution of the instantaneous time-variation, dHv/dt (dashed black curves, Eq. (23) in Pariat et al. 2015, and of the sum, dHj/dt + dHpj/dt (continuous blue curves, Eqs. (8) and (19)) for the dispersion peripheral run. The yellow bands correspond to the eruption onset phase.
Current usage metrics show cumulative count of Article Views (full-text article views including HTML views, PDF and ePub downloads, according to the available data) and Abstracts Views on Vision4Press platform.
Data correspond to usage on the plateform after 2015. The current usage metrics is available 48-96 hours after online publication and is updated daily on week days.
Initial download of the metrics may take a while.