Open Access
Fig. 1.
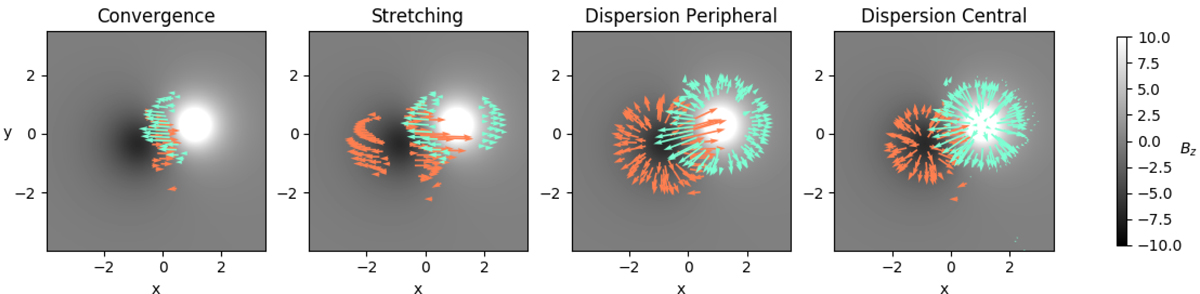
Applied boundary-driving motions for the four different numerical experiments. White represents the positive polarity (Bz(z = 0.006) > 0) and black the negative polarity (Bz(z = 0.006) < 0). Orange and cyan arrows indicate the distribution of the velocity flows we applied to the negative and positive polarity, respectively.
Current usage metrics show cumulative count of Article Views (full-text article views including HTML views, PDF and ePub downloads, according to the available data) and Abstracts Views on Vision4Press platform.
Data correspond to usage on the plateform after 2015. The current usage metrics is available 48-96 hours after online publication and is updated daily on week days.
Initial download of the metrics may take a while.