Fig. 5.
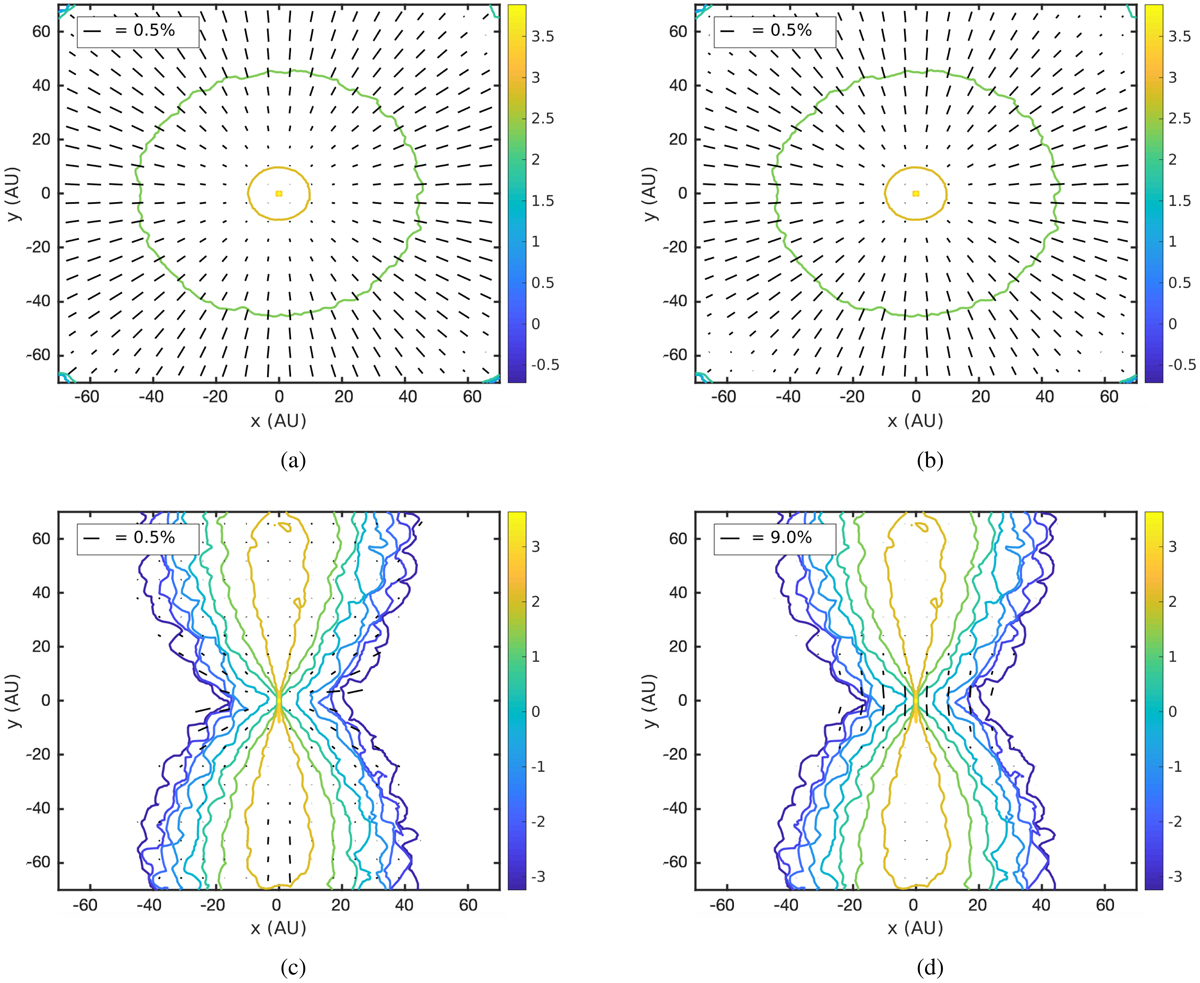
Contour plots of (the logarithm of) the total intensity (in Kelvin) of a protoplanetary disk. The disk is viewed face on (panels a and b) and at an inclination of 45° (panels c and d). We overlayed the intensity plot with polarization vectors from PORTAL simulations that come from a radial magnetic field (a,c) and a toroidal magnetic field (b,d). Polarization vector lengths scale with the polarization fraction.
Current usage metrics show cumulative count of Article Views (full-text article views including HTML views, PDF and ePub downloads, according to the available data) and Abstracts Views on Vision4Press platform.
Data correspond to usage on the plateform after 2015. The current usage metrics is available 48-96 hours after online publication and is updated daily on week days.
Initial download of the metrics may take a while.