Fig. 7
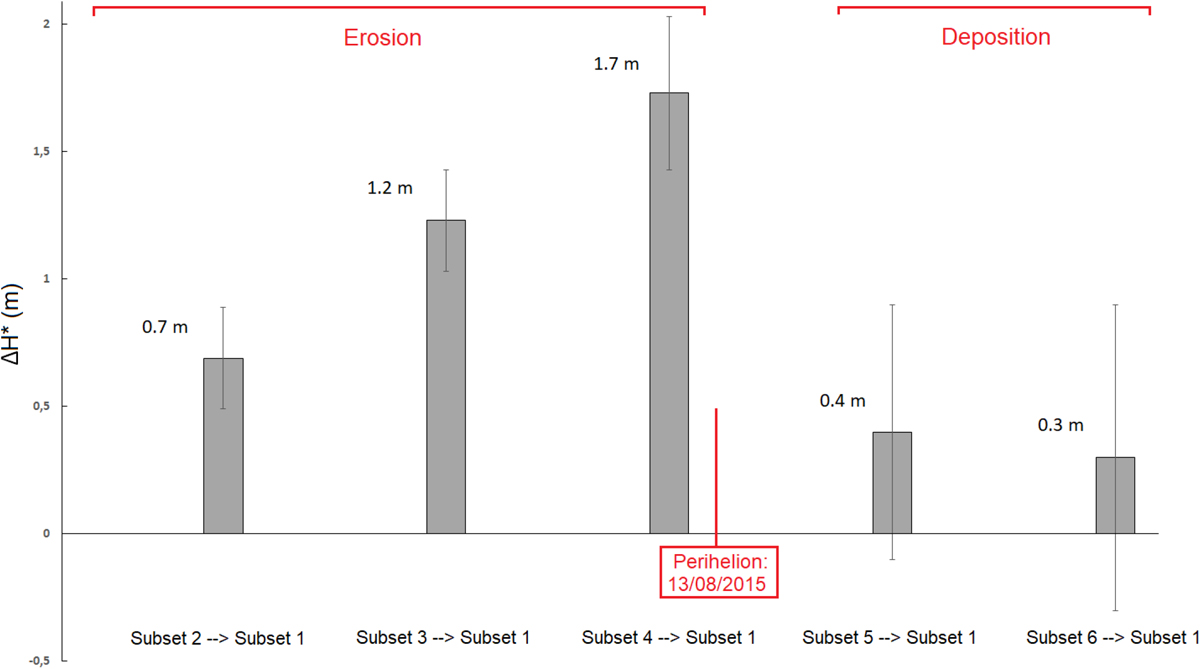
Time evolution of the boulder height differences ΔH* (as defined in text). Each time step contains information related to 22 boulders and the values correspond to the weighted average. They-axis reports the average height measurements referring to the subsets described in Sect. 4. Subset 1 refers to 21–22 August 2014. According to the illumination and visibility conditions, the time interval between Subset 1 and the perihelion is about 4 months. The time interval between the perihelion and Subset 6 is about one year. Erosion during the inbound orbit until December, 2014, nearly balances the fallout from the southern hemisphere during perihelion cometary activity. The dotted red line indicates the perihelion.
Current usage metrics show cumulative count of Article Views (full-text article views including HTML views, PDF and ePub downloads, according to the available data) and Abstracts Views on Vision4Press platform.
Data correspond to usage on the plateform after 2015. The current usage metrics is available 48-96 hours after online publication and is updated daily on week days.
Initial download of the metrics may take a while.