Fig. 3
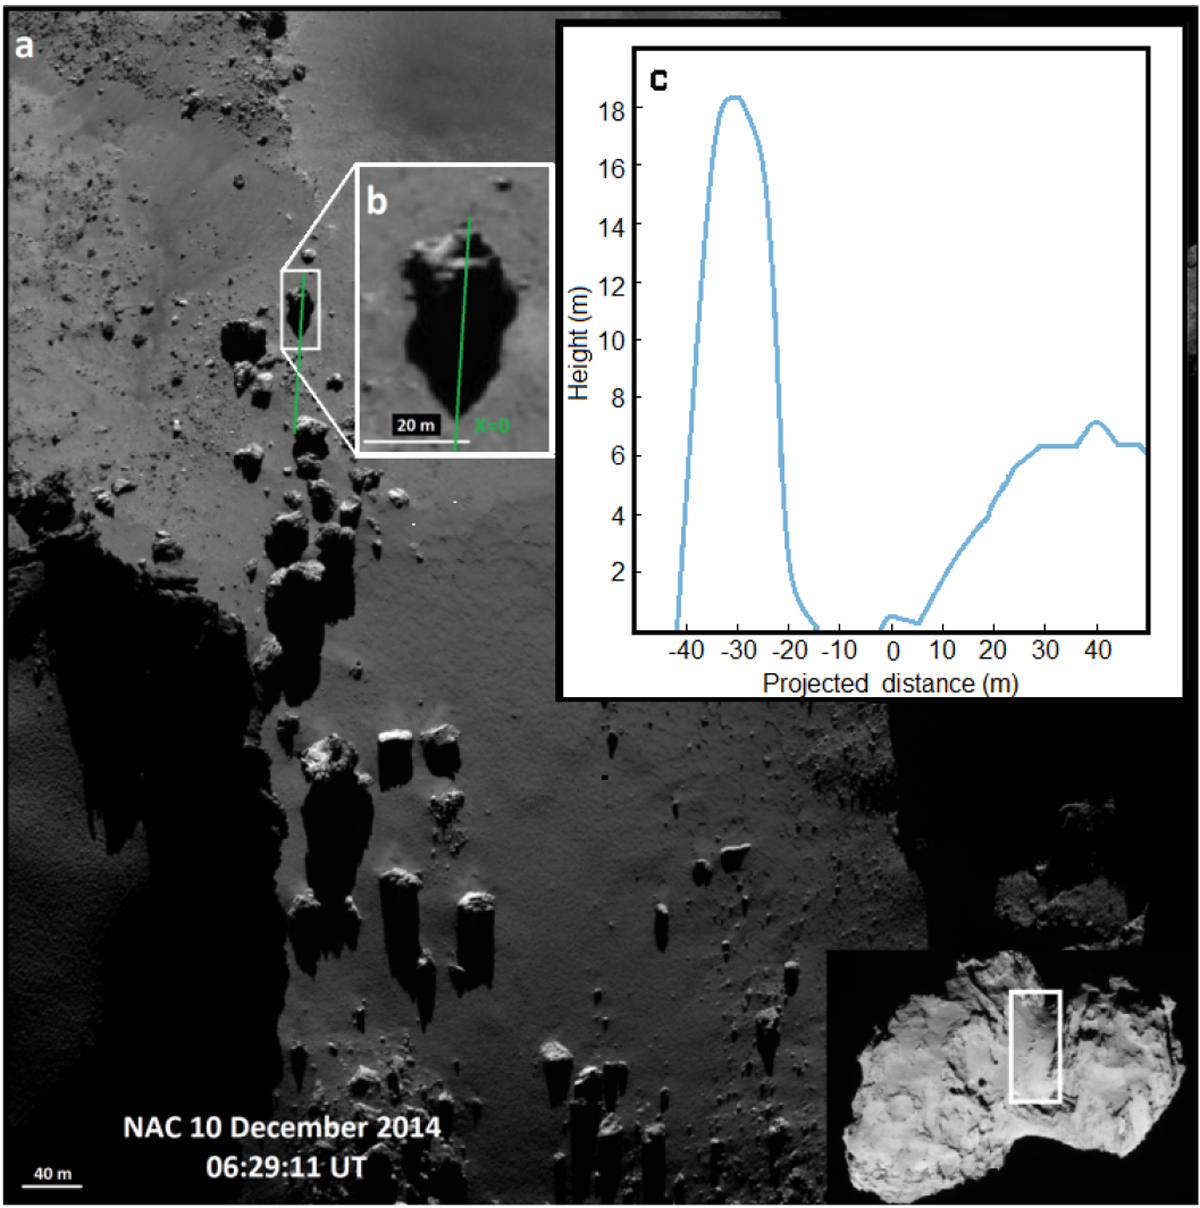
Plot a: NAC view of the Hapi region (0.37 m px−1); this image was acquired in 2014. Plot b: close-up of a boulder and of its shadow. The green line represents the projection of the Sun illumination direction. Plot c: boulder section (we note the different scales on the plot axes deforming the boulder shape). The y-axis is oriented as the normal to the average plane around the peak of the shadow. The x-axis is obtained by projecting the green line in plot b on this average plane; the x-axis origin coincides with the peak of the shadow. We note that by comparing plots b and c, the shadow lengths appear different because of projection effects.
Current usage metrics show cumulative count of Article Views (full-text article views including HTML views, PDF and ePub downloads, according to the available data) and Abstracts Views on Vision4Press platform.
Data correspond to usage on the plateform after 2015. The current usage metrics is available 48-96 hours after online publication and is updated daily on week days.
Initial download of the metrics may take a while.