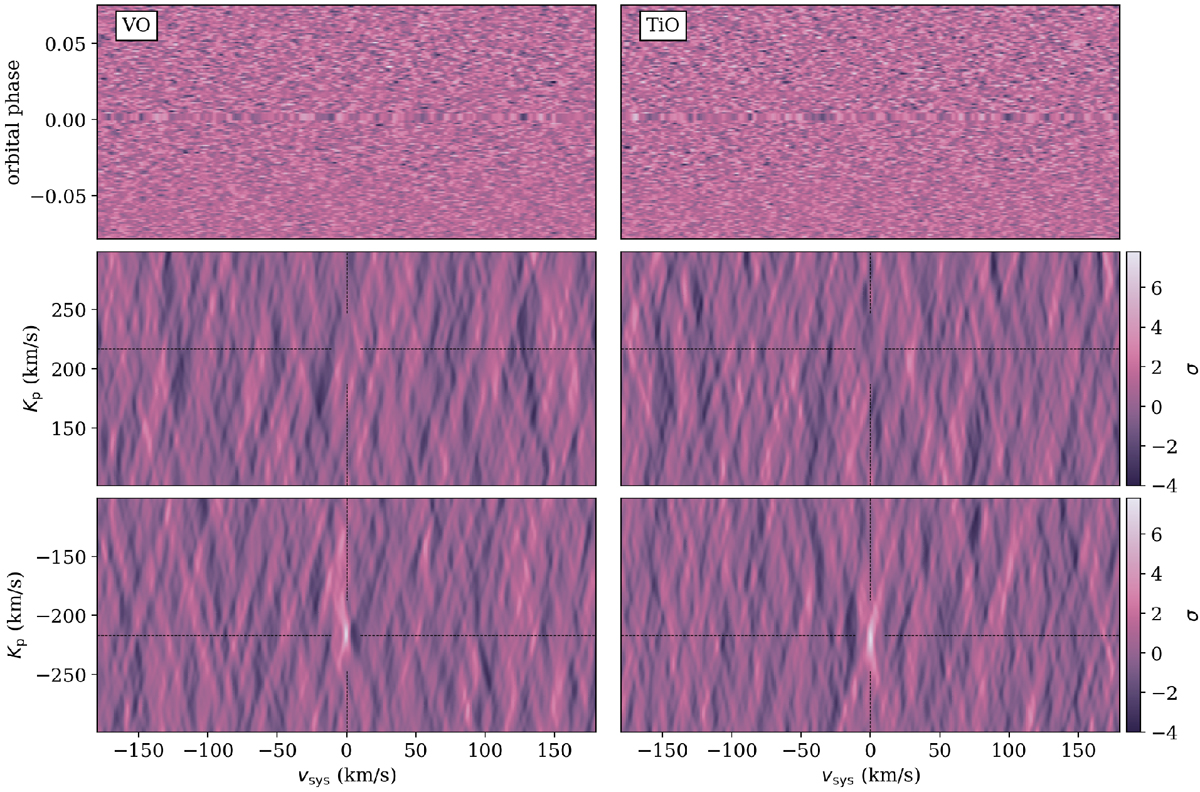
Fig. 4

Results from cross-correlation with VO (left) and TiO (right) templates, at a log VMR of −6.6 and −7 respectively, for 1500 K. Top row: cross-correlation function time series summed over all echelle orders, showing no visible trace. Middle: cross-correlation maps summed over all echelle orders, showing non-detections for both species: the black dotted lines indicate the expected velocity position for the signal (Kp = 217 km s−1). Bottom: results from injection tests, showing a detection of the injected signal at 6.9σ for VO and 7.2σ for TiO at the expected velocity position. We note that the expected value for vsys is zero as the spectra have been corrected to the stellar rest frame.
Current usage metrics show cumulative count of Article Views (full-text article views including HTML views, PDF and ePub downloads, according to the available data) and Abstracts Views on Vision4Press platform.
Data correspond to usage on the plateform after 2015. The current usage metrics is available 48-96 hours after online publication and is updated daily on week days.
Initial download of the metrics may take a while.


