Fig. 5
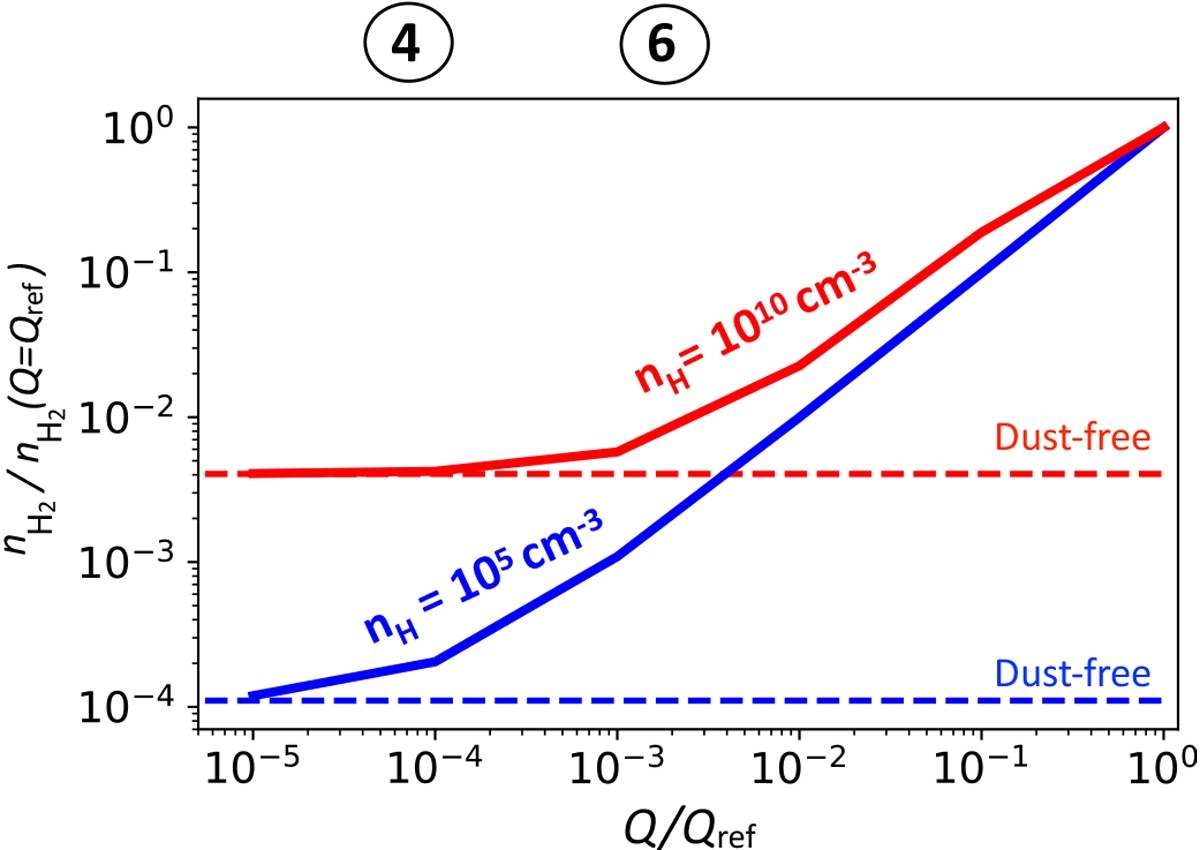
Steady-state abundances of H2 normalized to its value at Q∕Qref = 1 as a functionof Q∕Qref for two densities: nH =1010 cm−3 (solid red line) and nH = 105 cm−3 (solid blue line). Other parameters are constant and equal to their fiducial values (see Table 2). Gas-phase formation of H2 is dominatedby H− for nH = 1010 cm−3 (nH∕W = 2 × 1016 cm−3) and by CH+ for nH = 105 cm−3 (nH∕W = 2 × 1011 cm−3). Dashed linesindicate H2 abundance in the absence of dust. Abundances for each set of the model are normalized to their value at Q∕Qref = 1. We note that because of the low electron fraction at nH = 1010 cm−3 (xe ≃ 10−4), the formation on grains takes over from the formation via H− (boundary ⑥) at a lower dust fraction than indicated in Fig. 3.
Current usage metrics show cumulative count of Article Views (full-text article views including HTML views, PDF and ePub downloads, according to the available data) and Abstracts Views on Vision4Press platform.
Data correspond to usage on the plateform after 2015. The current usage metrics is available 48-96 hours after online publication and is updated daily on week days.
Initial download of the metrics may take a while.