Fig. 4
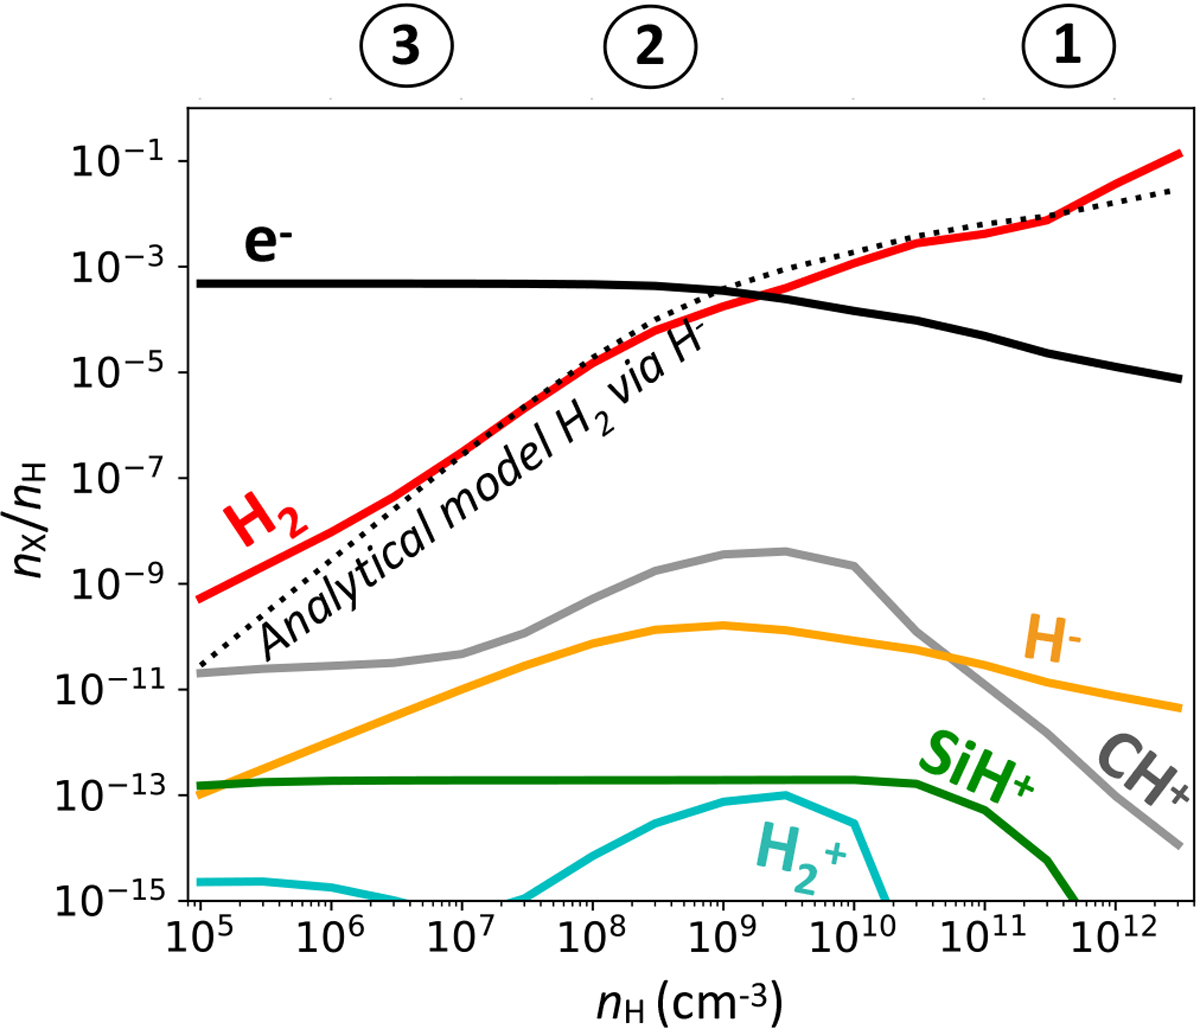
Steady-state abundances relative to total H nuclei for H2 and chemical species involved in its formation for dust-free single point models with G0 = 104, W = 5 × 10⁻⁷, TK = 1000 K, and nH ranging from105 to 2 × 1012 cm−3. An analytical expression of the steady state abundance of H2, assuming destruction by photodissociation and formation by H− only, is alsoplotted in black dotted line (see Appendix C). Boundaries defined in Fig. 3 are also indicated on the upper axis. It is important to note that because of the decrease of the electron fraction following recombination at high density, a three-body reaction takes over from the formation via H− (boundary ①) at a lower density than indicated in Fig. 3.
Current usage metrics show cumulative count of Article Views (full-text article views including HTML views, PDF and ePub downloads, according to the available data) and Abstracts Views on Vision4Press platform.
Data correspond to usage on the plateform after 2015. The current usage metrics is available 48-96 hours after online publication and is updated daily on week days.
Initial download of the metrics may take a while.