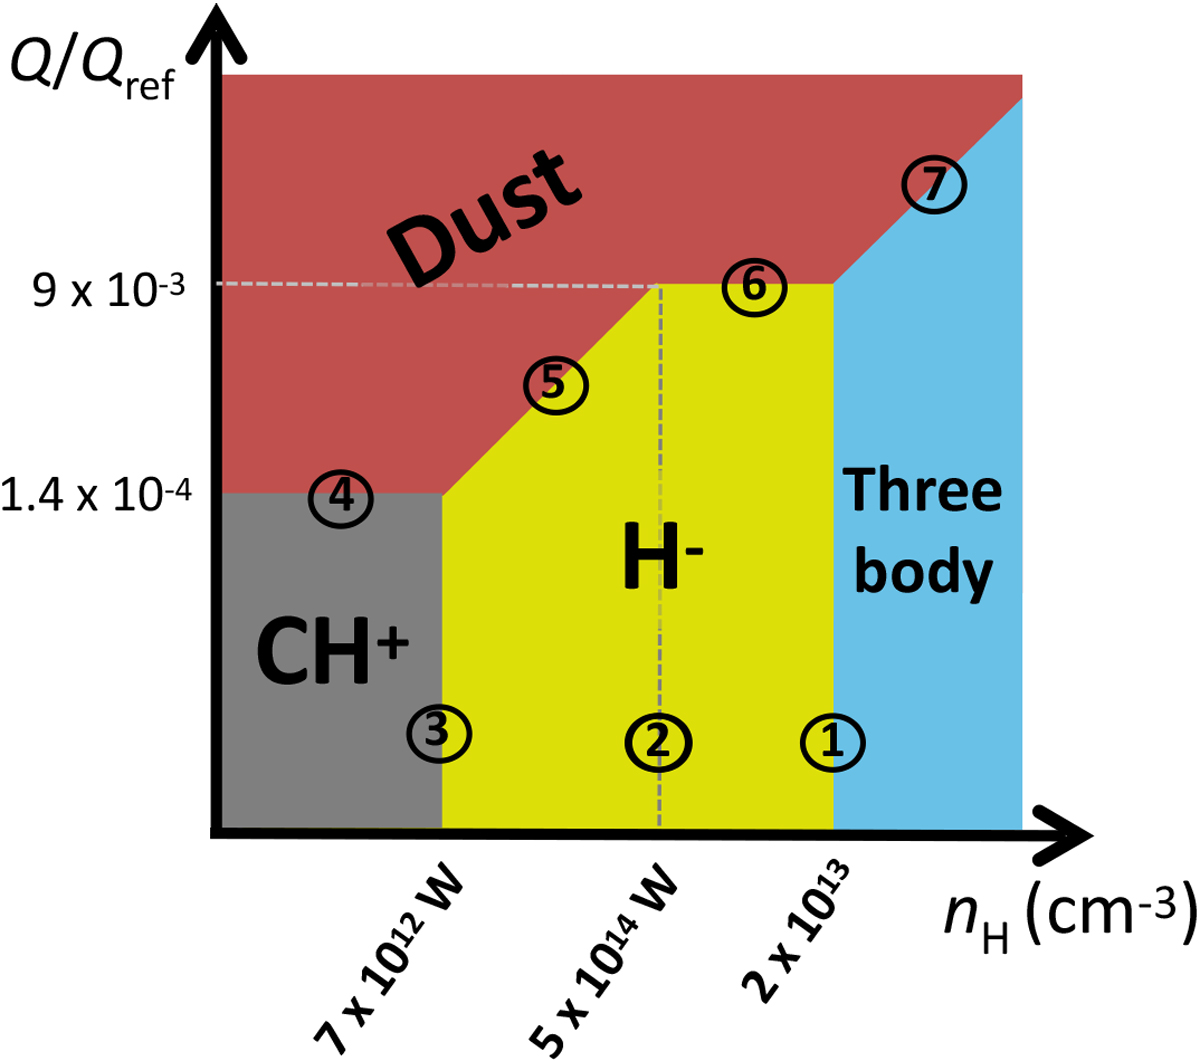
Fig. 3

Schematic view of the dominant H2 formation routes depending on the density, the dust fraction, and visible radiation field W summarizing our results presented in Sect. 3.1 and in Appendix C. The location of the boundaries are given for a temperature of TK = 1000 K, xe = 4.8 × 10⁻⁴, and x(C+) = 3.6 × 10⁻⁴. The schematic view remains valid from ≃100 K up to ≃ 5000 K. Dependencies on TK, xe, and x(C+) are given inAppendix C. We note that some limits depend on the visible flux W and others do not. Depending on the visible flux, boundaries ①, ②, and ③ can merge.
Current usage metrics show cumulative count of Article Views (full-text article views including HTML views, PDF and ePub downloads, according to the available data) and Abstracts Views on Vision4Press platform.
Data correspond to usage on the plateform after 2015. The current usage metrics is available 48-96 hours after online publication and is updated daily on week days.
Initial download of the metrics may take a while.


