Fig. 12
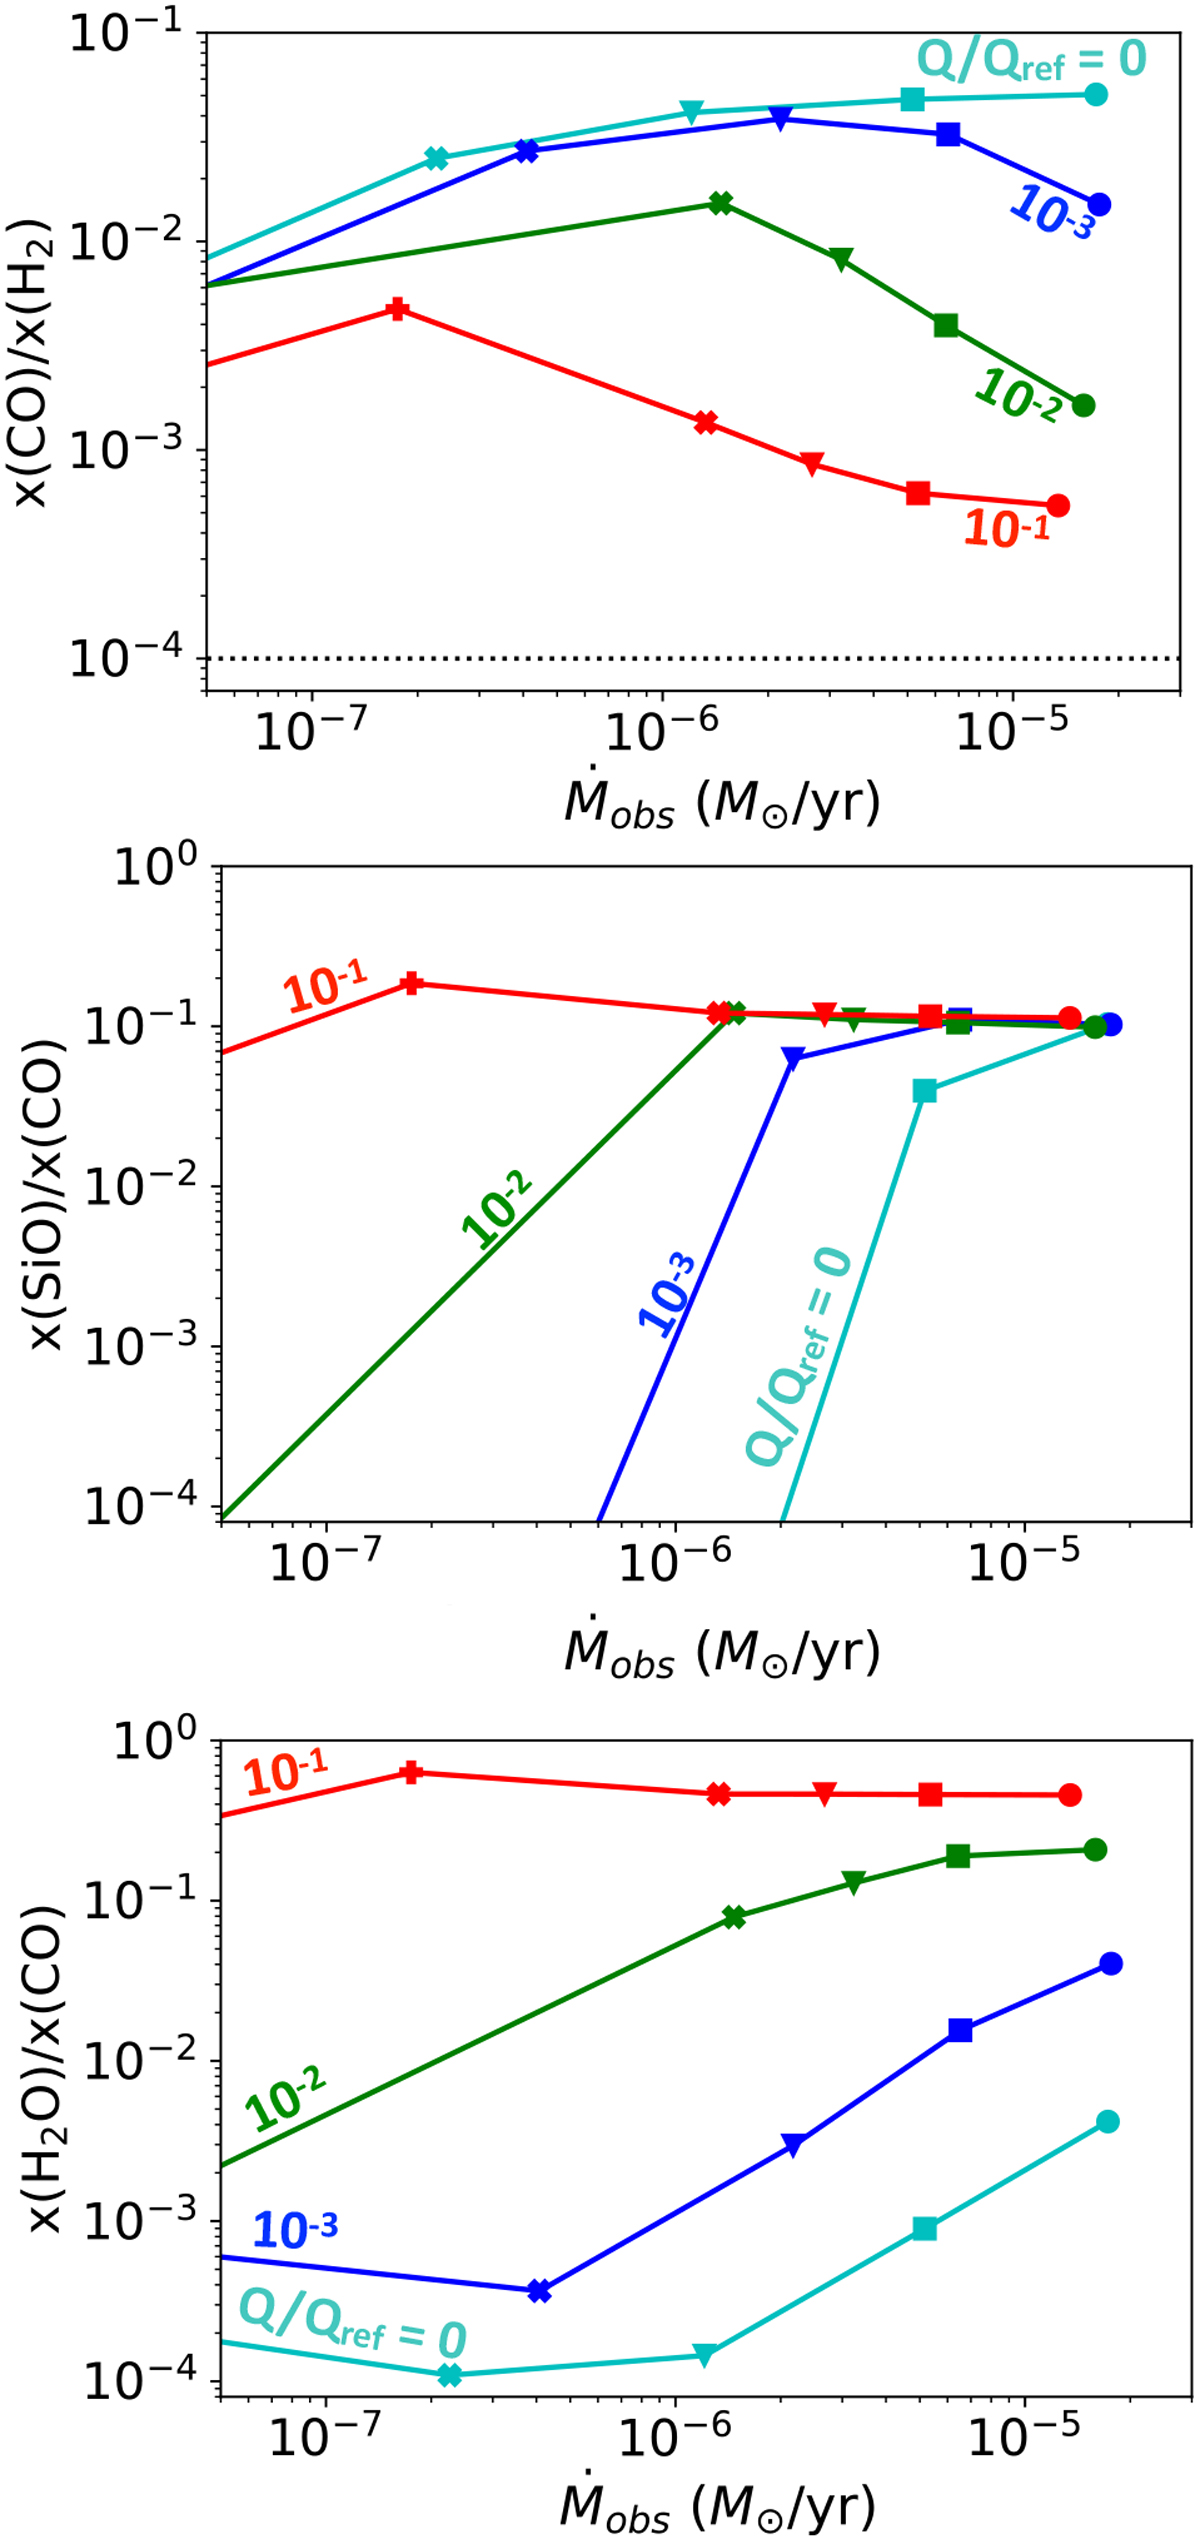
Asymptotic abundance ratios for a streamline launched at R0 = 0.15 au in the disk as a function of the “observed” mass-flux Ṁobs (see Eq. (21)) for dust-free models (cyan) and dust-poor models with Q∕Qref = 10−3 (blue), 10−2 (green), and 0.1 (red) as well as for different values of Ṁw = 10−7 (straight crosses), 5 × 10⁻⁷ (crosses), 10−6 (triangles), 2 × 10⁻⁶ (squares), and 5 × 10⁻⁶ (circles) M⊙ yr−1. All other parameters are kept constant to the values given in the footnote of Table 3. In particular TK = 1000 K.
Current usage metrics show cumulative count of Article Views (full-text article views including HTML views, PDF and ePub downloads, according to the available data) and Abstracts Views on Vision4Press platform.
Data correspond to usage on the plateform after 2015. The current usage metrics is available 48-96 hours after online publication and is updated daily on week days.
Initial download of the metrics may take a while.