Fig. 10
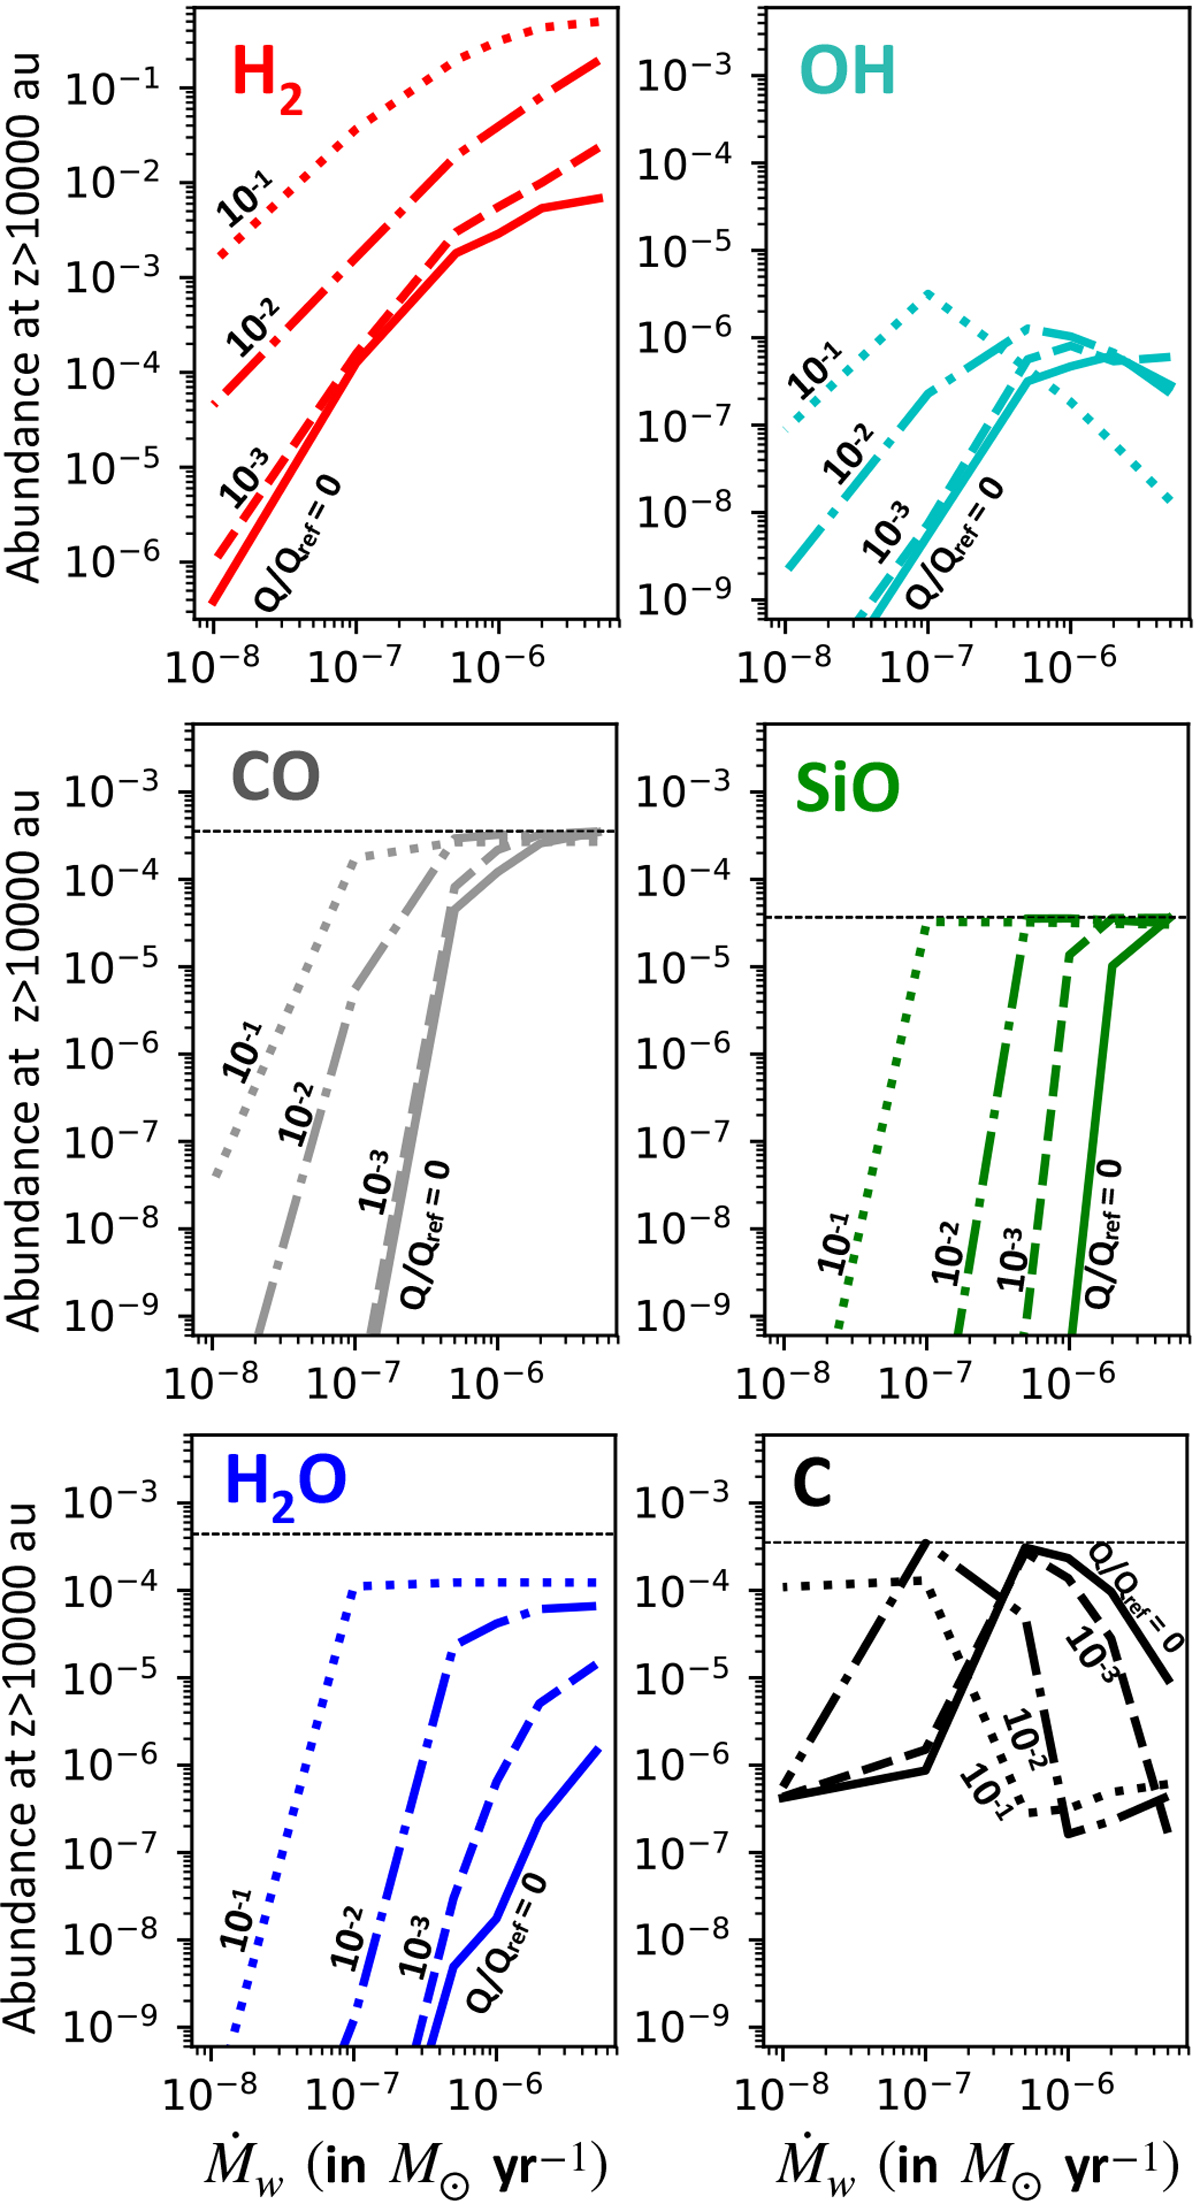
Abundances at z > 1000 au for a streamline anchored at 0.15 au in the disk as a function of the mass-loss rate for various dust fractions. For Ṁw ≥ 5 × 10⁻⁷ M⊙ yr−1, the mass of the central object is 0.1 M⊙ (Class 0 model) and 0.5 M⊙ for lower mass-loss rates (Class I and II models). Dust-free models are plotted in solid lines, and dust-poor models with Q∕Qref = 10−3, 10−2, and 0.1 are plotted in dashed, dashed-dotted, and dotted lines as indicated in each panel, respectively. Horizontal black dashed lines indicate the elemental abundance of carbon (panels on CO and C), silicon (panel on SiO), and oxygen (panel on H2O).
Current usage metrics show cumulative count of Article Views (full-text article views including HTML views, PDF and ePub downloads, according to the available data) and Abstracts Views on Vision4Press platform.
Data correspond to usage on the plateform after 2015. The current usage metrics is available 48-96 hours after online publication and is updated daily on week days.
Initial download of the metrics may take a while.