Fig. 2.
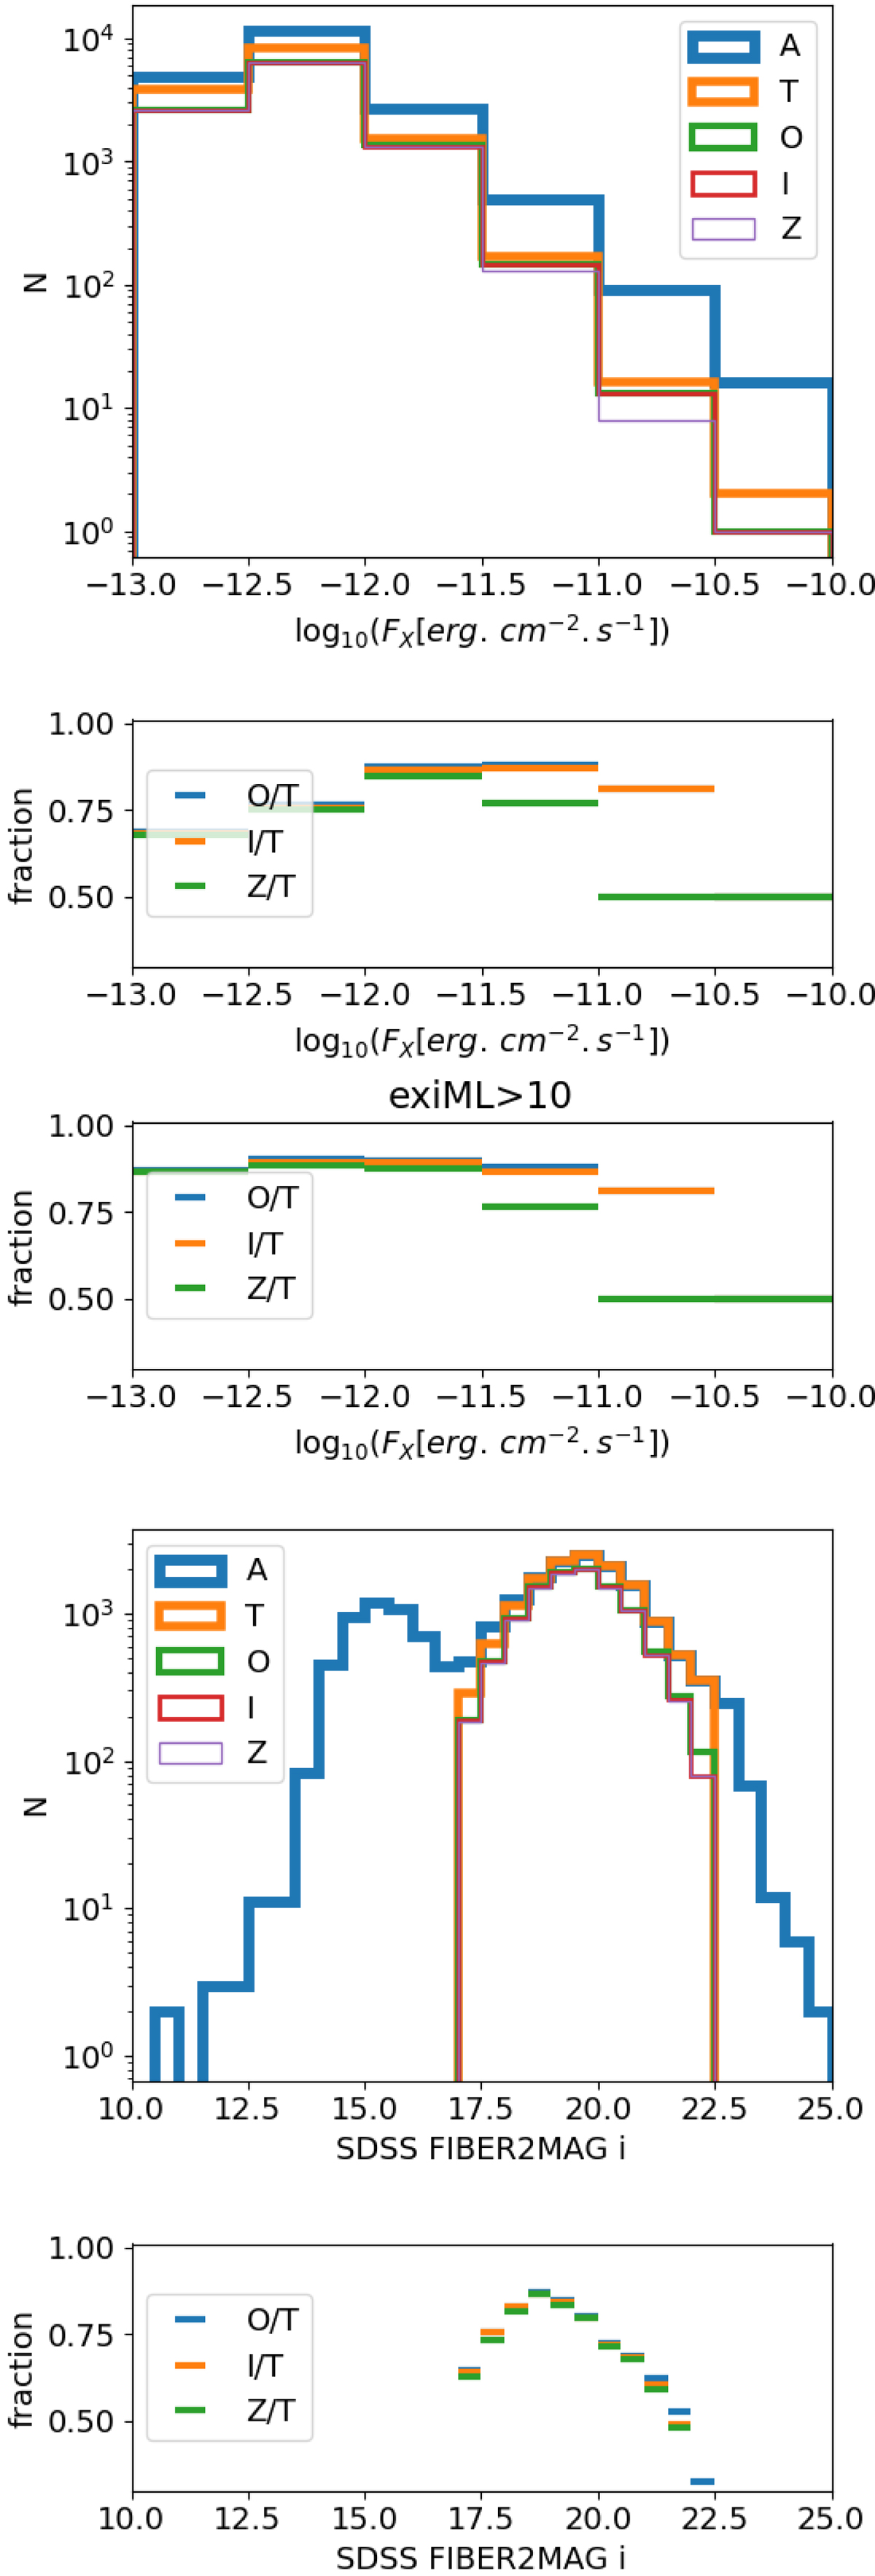
Histograms showing the 2RXS samples with exiML > 6.5 defined in Table 3: A, T, O, I, Z. The histogram of X-ray flux shows how bright the targets are (top panel). Second and third panel: fraction of observed targets, identified objects and good redshifts with respect to the targets sample. The second panel is for exiML > 6.5 and the third panel for exiML > 10. They show that the exiML > 10 Z sample is close to being a random sub sample of the targeted sample with a completeness slightly below 90%. The histogram of the i-band fibre 2 mag (fourth panel) shows the impact of the optical selection made on the counterparts found, which removes the bright objects. Similarly to the second panel, we show in the fifth panel the ratios O/T, I/T, Z/T as a function of fibre magnitude. This shows that identifying sources and determining their redshift is more difficult at the faint end.
Current usage metrics show cumulative count of Article Views (full-text article views including HTML views, PDF and ePub downloads, according to the available data) and Abstracts Views on Vision4Press platform.
Data correspond to usage on the plateform after 2015. The current usage metrics is available 48-96 hours after online publication and is updated daily on week days.
Initial download of the metrics may take a while.