Fig. A.1.
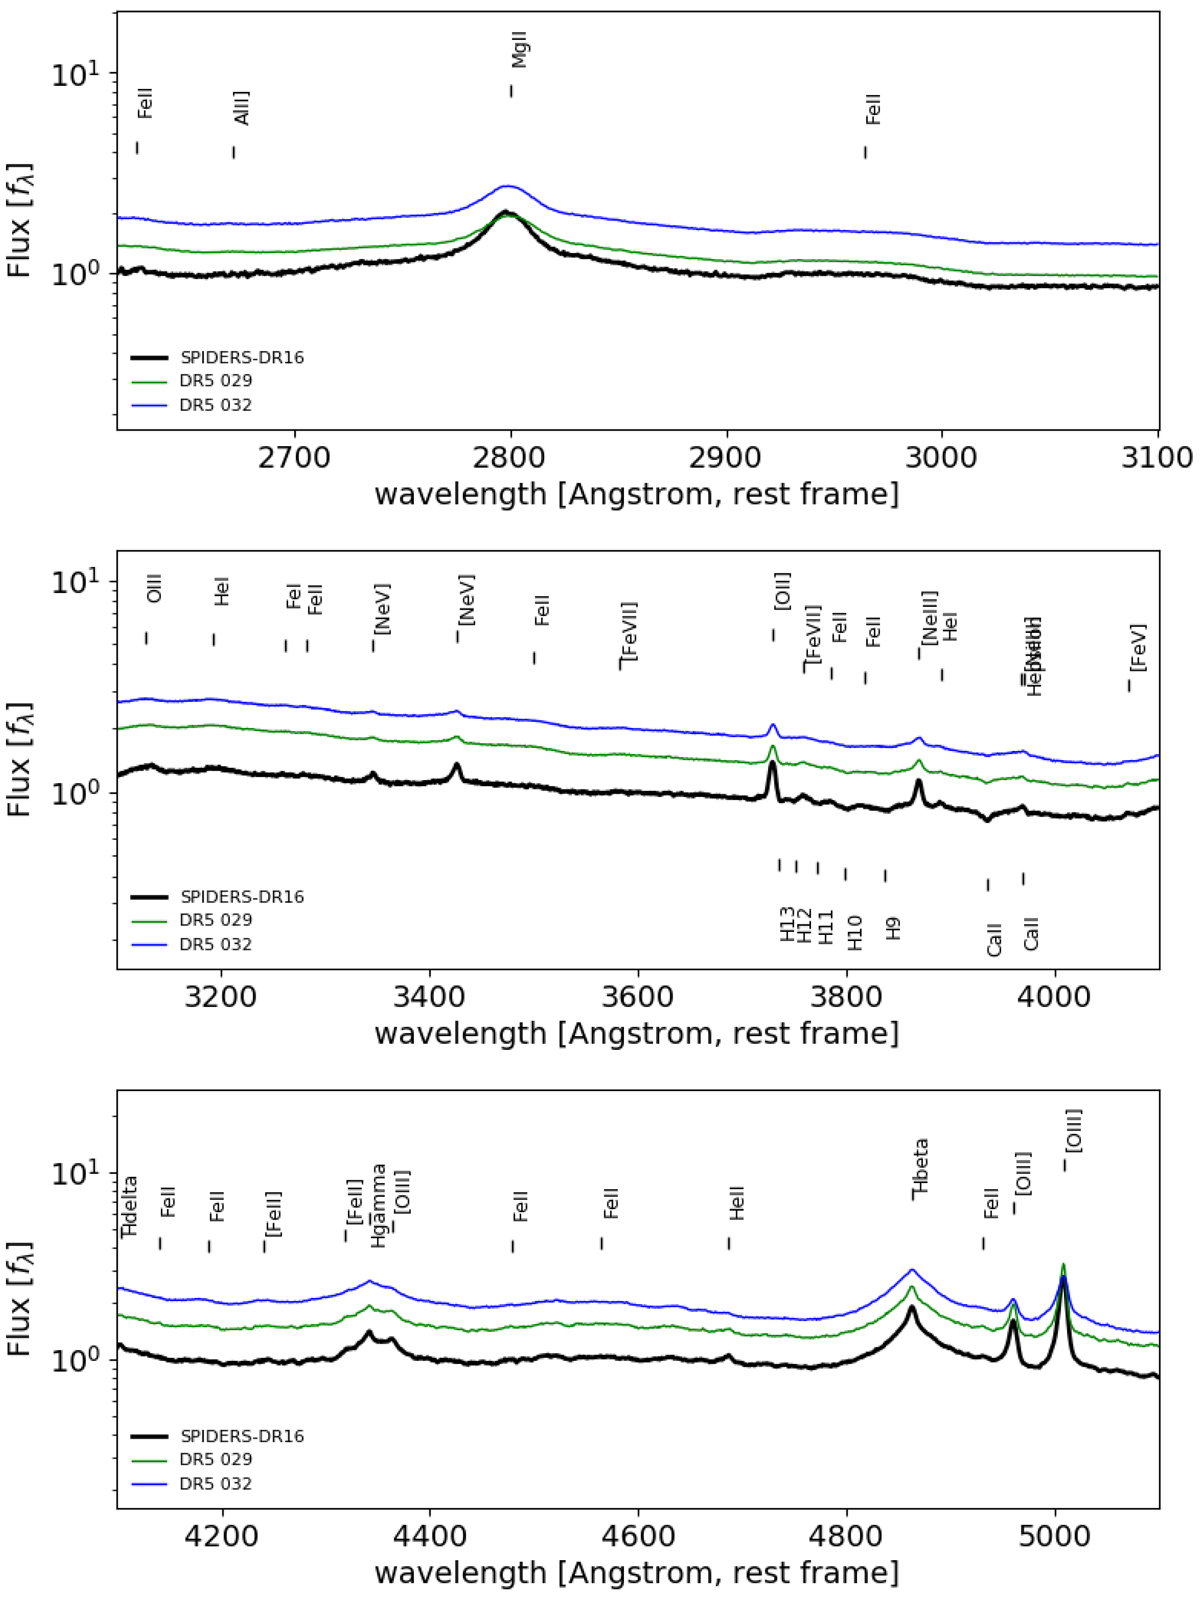
Zoom on the wavelength range 2100 < λ < 5100 of the type 1 AGN stack obtained over the redshift range 0.3 < z < 0.5 with the emission line from Vanden Berk et al. (2001) marked. For comparison, we show the SDSS DR5 spectral templates of the QSO (DR5 29) and of the luminous QSO (DR5 32) (Adelman-McCarthy et al. 2007). Emission line features are more marked (higher equivalent widths) in the SPIDERS templates. Vertical displacement between spectra are added for clarity.
Current usage metrics show cumulative count of Article Views (full-text article views including HTML views, PDF and ePub downloads, according to the available data) and Abstracts Views on Vision4Press platform.
Data correspond to usage on the plateform after 2015. The current usage metrics is available 48-96 hours after online publication and is updated daily on week days.
Initial download of the metrics may take a while.