Open Access
Fig. 15.
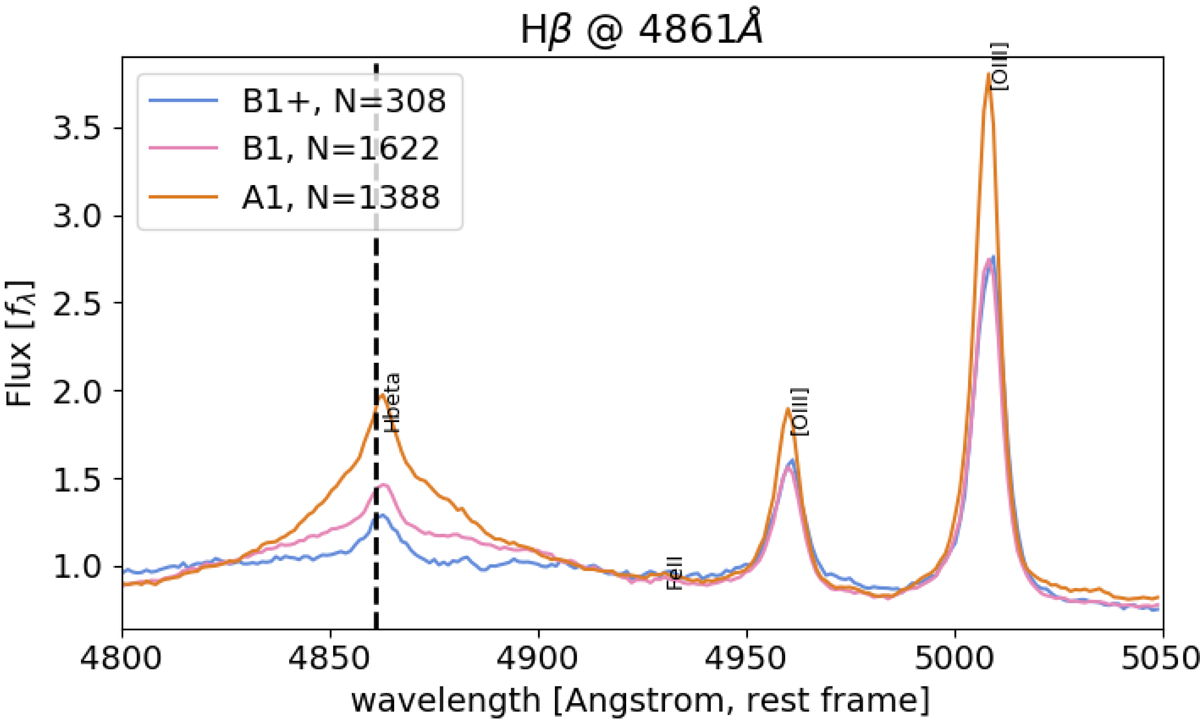
Spectral stacks for objects classified as type 1 AGN. A zoom on the Hβ spectral region is presented. The stacks are divided by their median flux to ease comparison. Stacks are taken in bins along the vertical EV1 sequence Sulentic et al. (2002) with the emission line from Vanden Berk et al. (2001) marked.
Current usage metrics show cumulative count of Article Views (full-text article views including HTML views, PDF and ePub downloads, according to the available data) and Abstracts Views on Vision4Press platform.
Data correspond to usage on the plateform after 2015. The current usage metrics is available 48-96 hours after online publication and is updated daily on week days.
Initial download of the metrics may take a while.