Fig. 7.
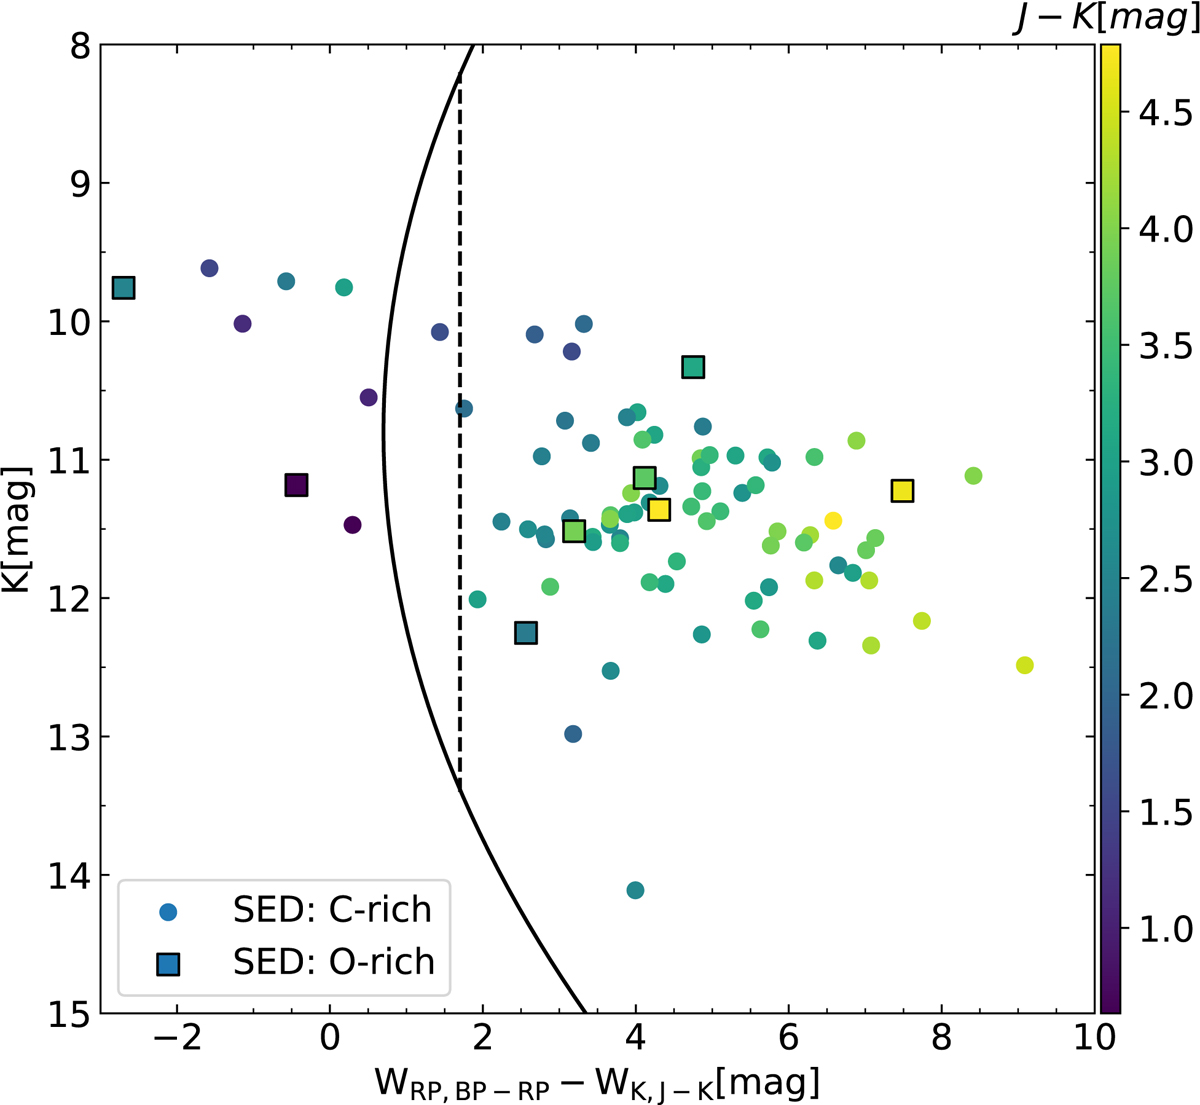
Classification of the AGB candidates in this work based on the VISTA Ks band and Gaia DR2 photometry (Lebzelter et al. 2018). The solid line indicates the separation between oxygen-rich (O) stars (to the left of the curve) and C stars, while the dashed line separates C stars from the most extreme dust-enshrouded stars. All the stars are colour-coded according to their (J − K) colours.
Current usage metrics show cumulative count of Article Views (full-text article views including HTML views, PDF and ePub downloads, according to the available data) and Abstracts Views on Vision4Press platform.
Data correspond to usage on the plateform after 2015. The current usage metrics is available 48-96 hours after online publication and is updated daily on week days.
Initial download of the metrics may take a while.