Fig. 5.
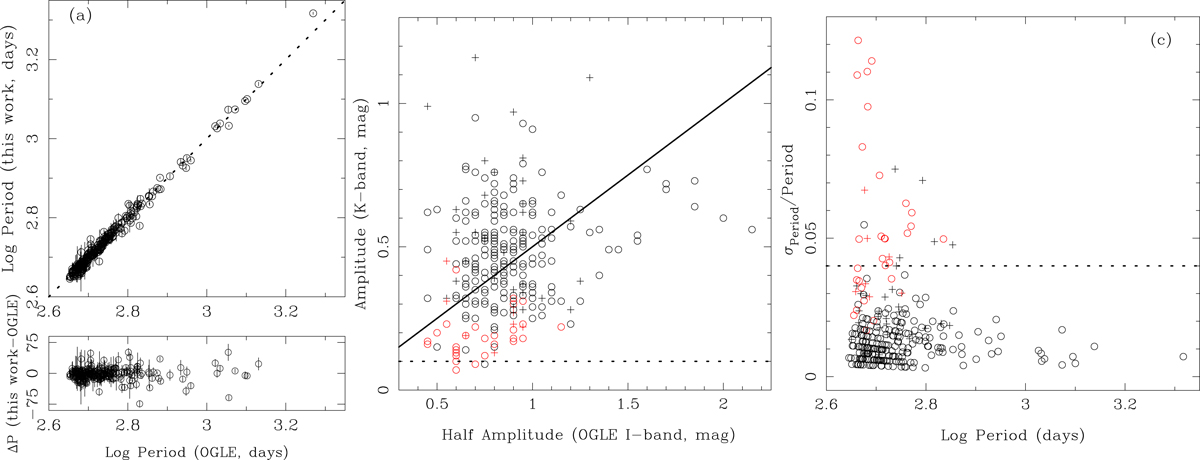
Pulsation properties of 294 confirmed Miras by OGLE compared with our results. Left panel a: directly compares the periods in the upper part; the dotted line marks the one-to-one relation. The lower part indicates the difference in periods as a function of the period found by OGLE. The star at P = 1858 d (log P = 3.26) in the top panel is located outside the plot at ΔPeriod = 216 d in the bottom panel. Middle panel b: compares the amplitude in the K band to that in the I band. The OGLE team defines amplitude as the minimum-to-maximum variation, while we use the traditional definition (see Eq. (1)). Stars with a ![]() are marked by a plus sign, and stars where the error on the K-band amplitude is larger than the amplitude are marked in red. The dotted line indicates the cut-off value of 0.1 mag we used to select the maximum number of known Miras from our sample. The solid line has a slope 0.5 to guide the eye. Right-hand panel c: relative error of the period determination against the period. Stars with a
are marked by a plus sign, and stars where the error on the K-band amplitude is larger than the amplitude are marked in red. The dotted line indicates the cut-off value of 0.1 mag we used to select the maximum number of known Miras from our sample. The solid line has a slope 0.5 to guide the eye. Right-hand panel c: relative error of the period determination against the period. Stars with a ![]() are marked by a plus sign, and stars where the error on the K-band amplitude is larger than the amplitude are marked in red. The dotted line indicates the cut-off value of 4% error on the period determination we used to select Miras from our sample.
are marked by a plus sign, and stars where the error on the K-band amplitude is larger than the amplitude are marked in red. The dotted line indicates the cut-off value of 4% error on the period determination we used to select Miras from our sample.
Current usage metrics show cumulative count of Article Views (full-text article views including HTML views, PDF and ePub downloads, according to the available data) and Abstracts Views on Vision4Press platform.
Data correspond to usage on the plateform after 2015. The current usage metrics is available 48-96 hours after online publication and is updated daily on week days.
Initial download of the metrics may take a while.