Fig. 3.
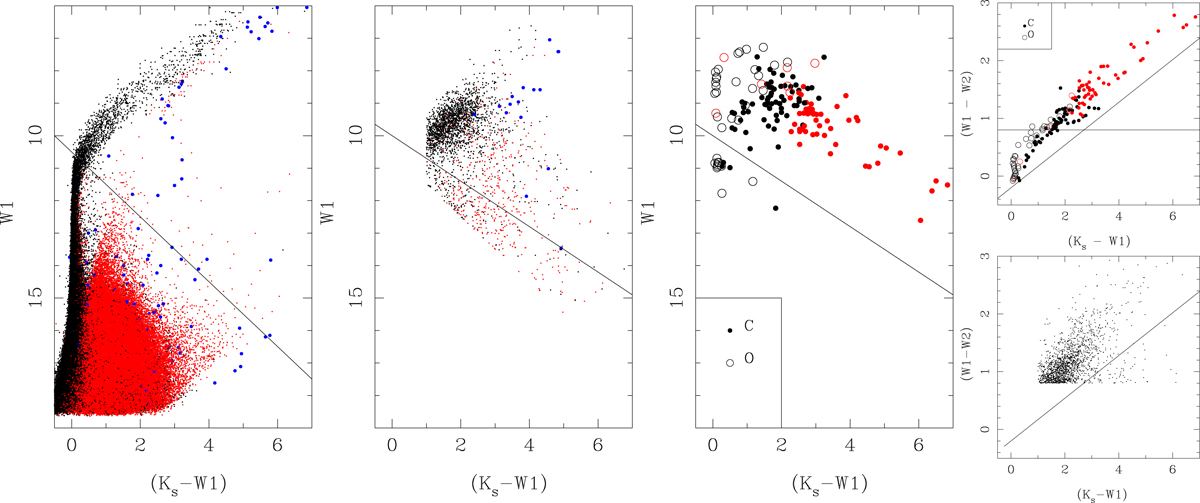
WISE-VMC (W1, Ks − W1) CMD and (W1 − W2)−(Ks − W1) CCDs. Left-most panel: CMD in a region between the SMC and LMC (a strip at 30° < RA < 60°). The line W1 = 1.0 ⋅ (K − W1)+10.5 mag indicates the upper boundary of the region predominantly occupied by galaxies. Second panel from the left: all WISE-VMC sources that are brighter than the boundary line in the left-hand panel, (Ks − W1) > 1 mag and (W1 − W2) > 0.5 mag. Objects that are (probable) stars are indicated in black, and (probable) galaxies (extended objects) are indicated in red, while objects classified differently are indicated in blue in these two panels. The provenance of the line in the second panel is explained in the next panel. The corresponding CCD is shown in the bottom half of the right-most panel. Third panel from the left: synthetic CMD based on GS18 for 29 SMC and 133 LMC O- (open circles) and C-rich (filled circles) AGB stars with pulsation periods longer than 450 days. The pulsation periods of the objects marked in red are derived from K/Ks or WISE-band data, and the black points are derived from optical data (OGLE, EROS, and MACHO). The line W1 = 0.7 ⋅ (Ks − W1)+10.0 mag is the empirical lower boundary to the reddest AGB stars, and it is also shown in the second panel from the left. The corresponding CCD diagram is shown in the top half of the right-most panel with the lines (W1 − W2) = 0.8 mag and (W1 − W2) = 0.37 ⋅ (Ks − W1)−0.2 mag, which indicates the empirical lower boundary to the reddest AGB stars, and is also shown in the panel below it.
Current usage metrics show cumulative count of Article Views (full-text article views including HTML views, PDF and ePub downloads, according to the available data) and Abstracts Views on Vision4Press platform.
Data correspond to usage on the plateform after 2015. The current usage metrics is available 48-96 hours after online publication and is updated daily on week days.
Initial download of the metrics may take a while.