Fig. C.1.
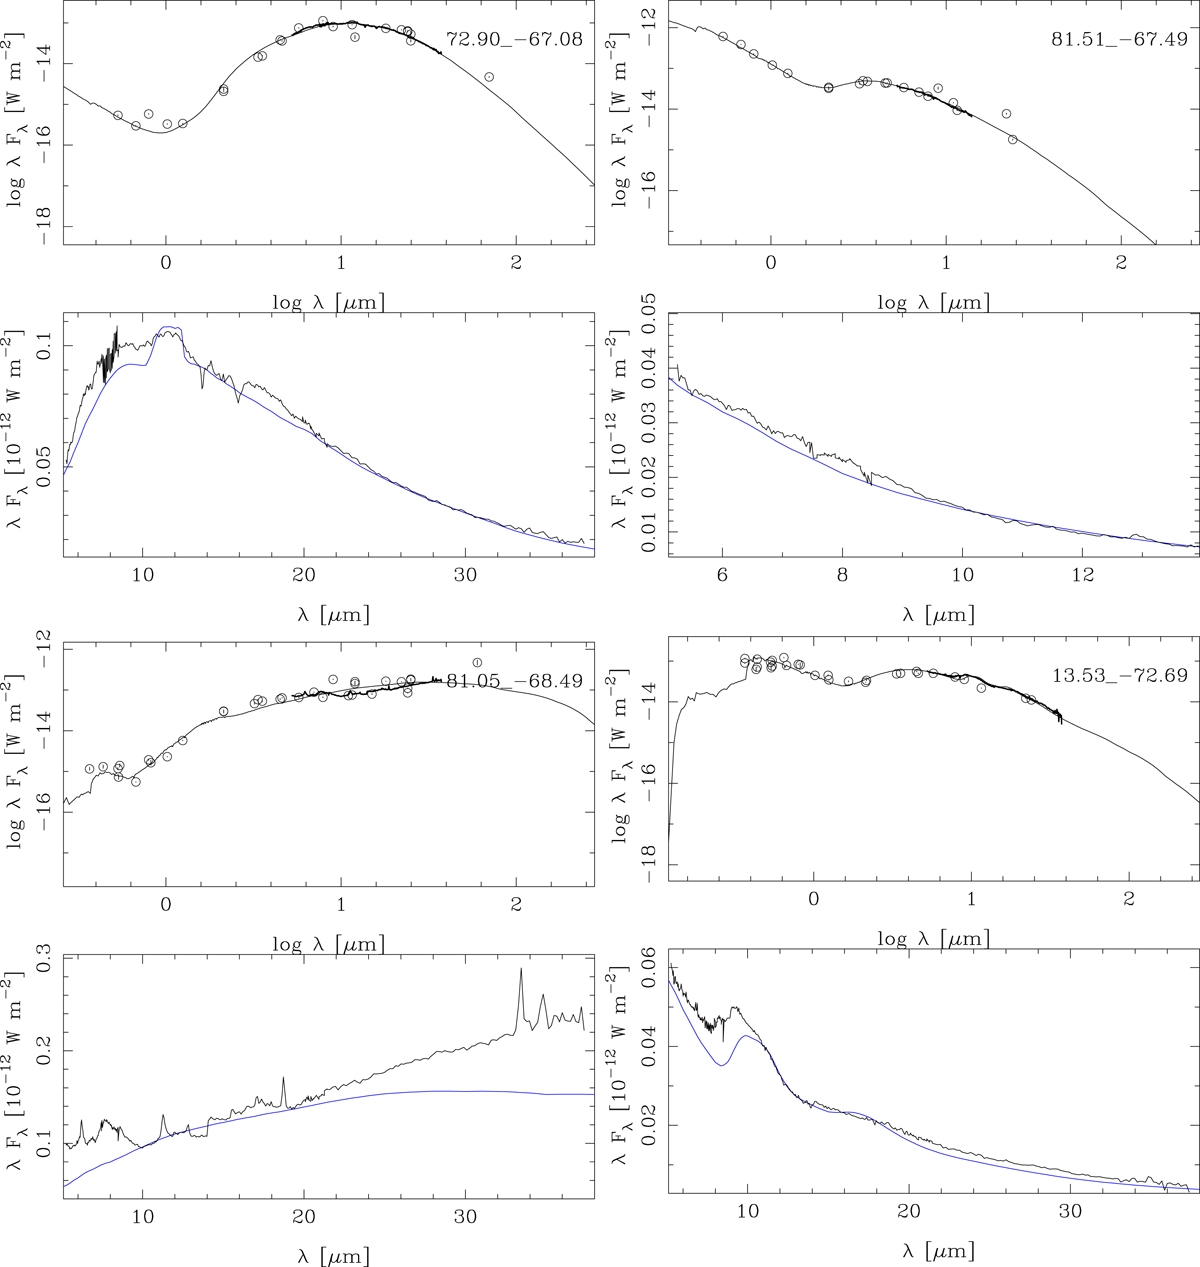
SEDs and Spitzer spectra of a C-rich post-AGB/PN star (top left), a WR star (top right), an HII region (bottom left), and a Be star (bottom right). See the notes to Table C.1 for the spectroscopic classification. In the panels with the Spitzer IRS spectra, the models (blue lines) are scaled to the observed spectra based on the average flux in the 12−13 μm region. For simplicity, the identifiers are the RA and Dec from Table A.1 truncated to two decimal figures.
Current usage metrics show cumulative count of Article Views (full-text article views including HTML views, PDF and ePub downloads, according to the available data) and Abstracts Views on Vision4Press platform.
Data correspond to usage on the plateform after 2015. The current usage metrics is available 48-96 hours after online publication and is updated daily on week days.
Initial download of the metrics may take a while.