Fig. A.1.
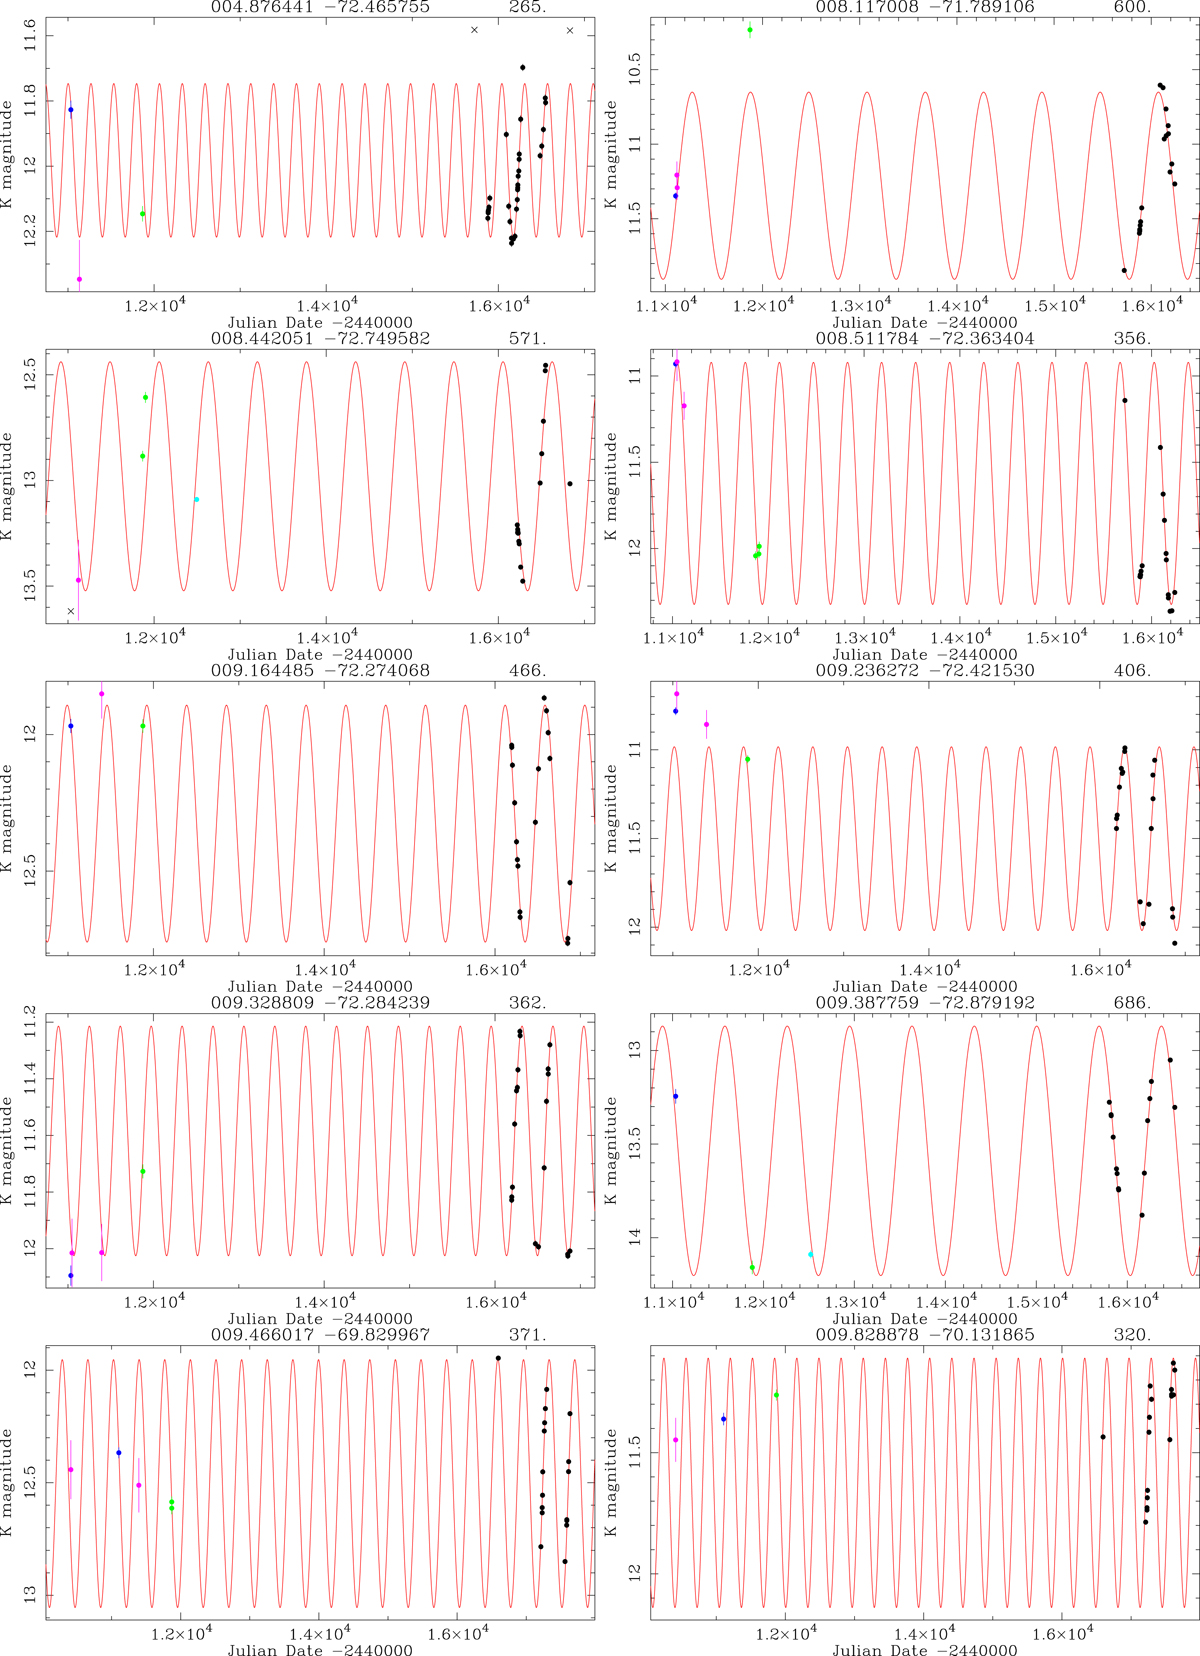
Examples of the LC fitting (red solid lines) to the observed time photometry At the top of the plot the identifier and the period (in days) are listed. Data points (with error bars) are identified as black for the VMC, green for 2MASS, dark blue for 2MASS-6X, light blue for IRSF, magenta for DENIS, and orange for other sources (see references in the footnote to Table A.3). Black crosses indicate points that were excluded from the fits. The complete set of LC is available at https://zenodo.org/record/3714889.
Current usage metrics show cumulative count of Article Views (full-text article views including HTML views, PDF and ePub downloads, according to the available data) and Abstracts Views on Vision4Press platform.
Data correspond to usage on the plateform after 2015. The current usage metrics is available 48-96 hours after online publication and is updated daily on week days.
Initial download of the metrics may take a while.