Fig. 10.
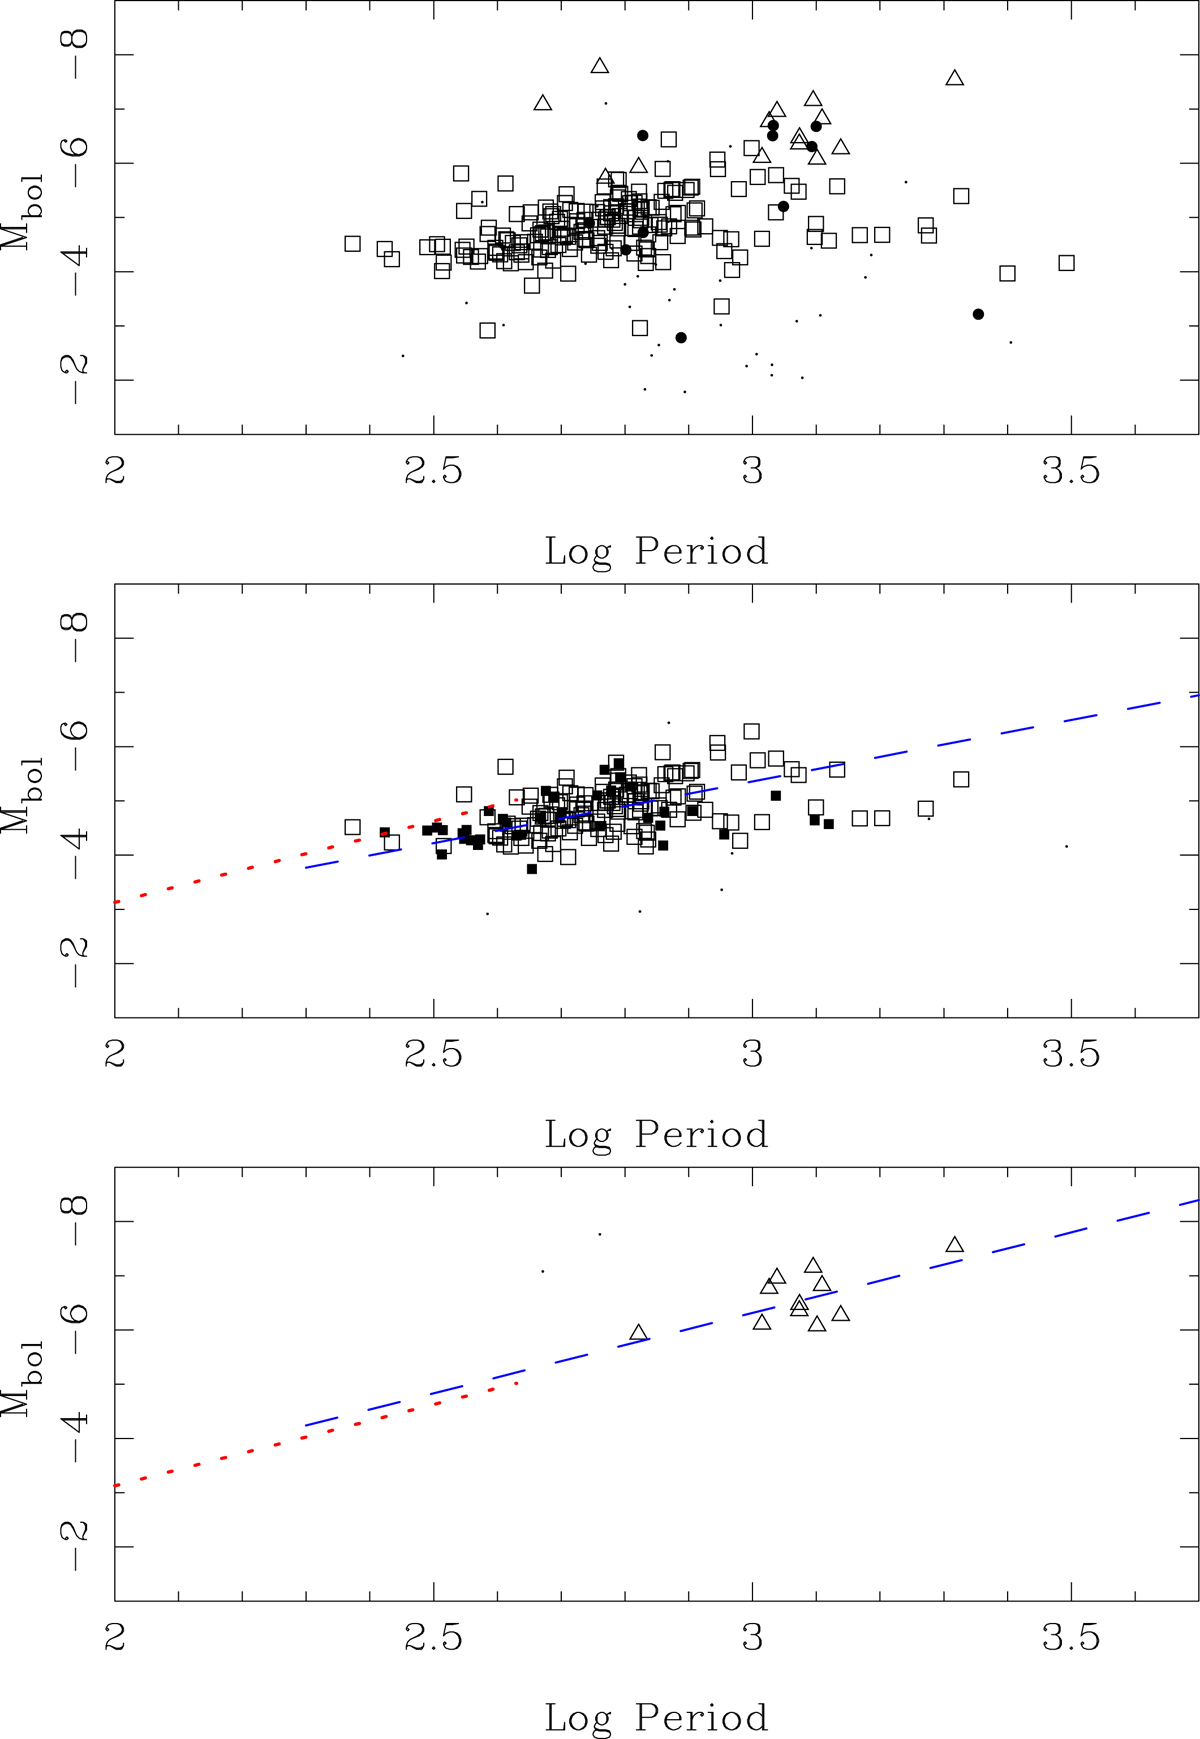
Bolometric PL-relations for all the 254 objects for which the template fitting was performed (top panel), and the subsets of likely C-rich Miras (middle panel), and O-rich Miras (bottom panel). The likely C-rich objects are plotted as open squares, the likely O-rich objects are plotted as open triangles, and the other AGB stars as filled circles, see the main text for details. The 37 likely non-AGB stars are plotted as dots. The likely C-rich Miras (with an amplitude >0.2 mag) are plotted in the middle panel. The objects in the LMC are plotted with open symbols, and those in the SMC with filled symbols. The blue dashed line is a fit to the data, excluding outliers (plotted as dots). The likely O-rich Miras (with an amplitude >0.2 mag) are plotted in the bottom panel. The blue dashed line is a fit to the data, excluding outliers (plotted as dots). The red dotted lines in the two panels indicate relations from the literature derived at shorter periods, see the main text for details.
Current usage metrics show cumulative count of Article Views (full-text article views including HTML views, PDF and ePub downloads, according to the available data) and Abstracts Views on Vision4Press platform.
Data correspond to usage on the plateform after 2015. The current usage metrics is available 48-96 hours after online publication and is updated daily on week days.
Initial download of the metrics may take a while.