Fig. 1.
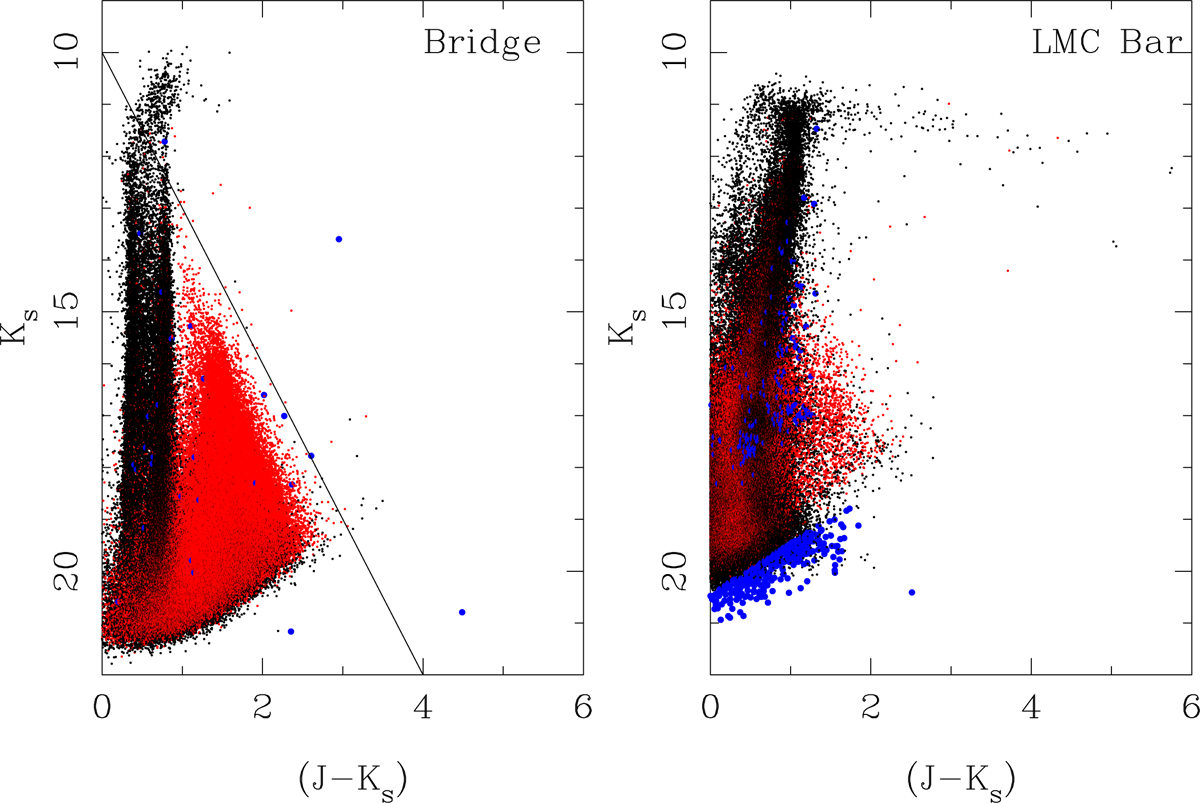
VMC (Ks, (J − Ks)) CMD in a region in the Magellanic Bridge (left-hand panel; a strip at 42° < RA < 52° and −72.5° < Dec < −73.8°) and in the LMC bar (right-hand panel; a box defined as 80° < RA < 82°, and −69° < Dec < −70°). Objects that are (probable) stars are indicated in black, and (probable) galaxies (extended objects) are indicated in red. Objects classified differently are indicated in blue. The line, K = 3 ⋅ (J − K) + 10 mag, indicates the approximate boundary of galaxies.
Current usage metrics show cumulative count of Article Views (full-text article views including HTML views, PDF and ePub downloads, according to the available data) and Abstracts Views on Vision4Press platform.
Data correspond to usage on the plateform after 2015. The current usage metrics is available 48-96 hours after online publication and is updated daily on week days.
Initial download of the metrics may take a while.