Free Access
Fig. B.6.
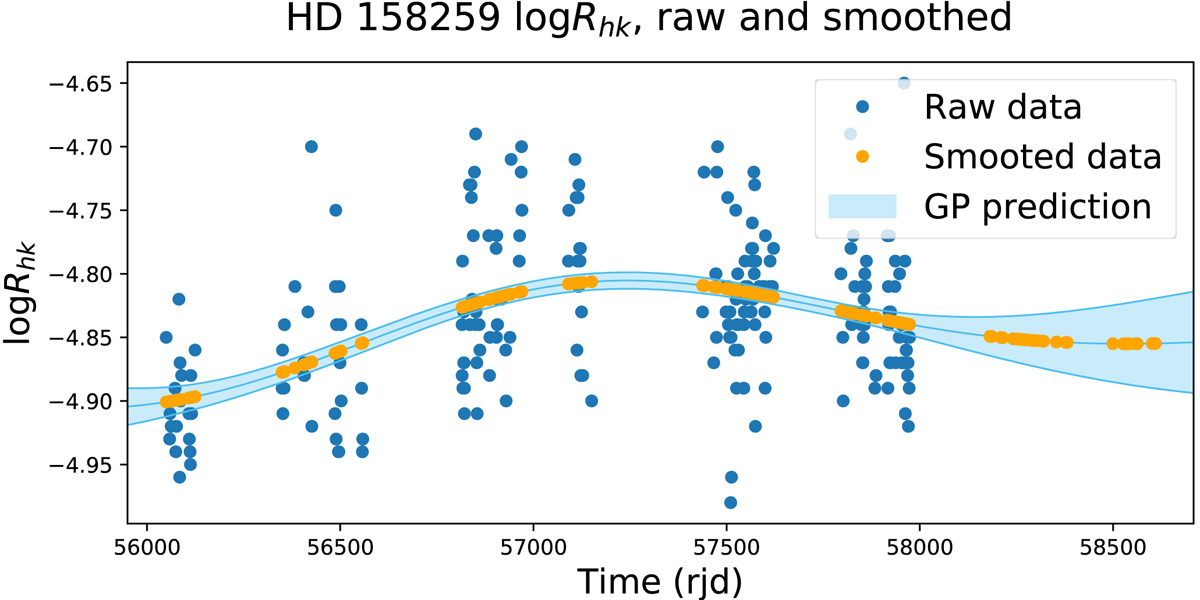
Raw and smoothed ![]() time series. The dark blue points represent the raw
time series. The dark blue points represent the raw ![]() data used for the prediction. The light blue lines represent the Gaussian process prediction and its ±1σ error bars (see Eq. (B.2)). The orange points are the predicted values of the Gaussian process at the radial velocity measurement times.
data used for the prediction. The light blue lines represent the Gaussian process prediction and its ±1σ error bars (see Eq. (B.2)). The orange points are the predicted values of the Gaussian process at the radial velocity measurement times.
Current usage metrics show cumulative count of Article Views (full-text article views including HTML views, PDF and ePub downloads, according to the available data) and Abstracts Views on Vision4Press platform.
Data correspond to usage on the plateform after 2015. The current usage metrics is available 48-96 hours after online publication and is updated daily on week days.
Initial download of the metrics may take a while.