Fig. 9.
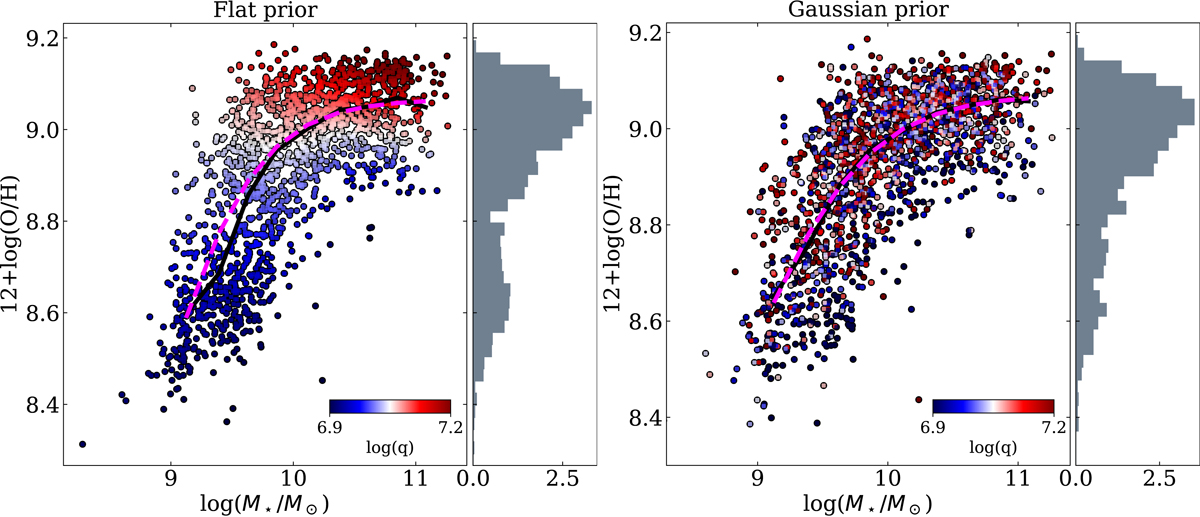
Mass–metallicity relation for the MaNGA star-forming galaxies considered in this work with (right) and without (left) using the [S III] lines via an ionisation parameter prior as discussed in the text. Metallicities are computed for each galaxy at 0.8 Re. The colour-coding indicates the ionisation parameter (at 0.8 Re). A histogram of the metallicity distributions for all galaxies is shown in grey on the right. In the case where the [S III] lines are not used (left panel) there is a striking correlation at fixed mass between metallicity and ionisation paramater. To visually highlight this correlation the colour-coding has been smoothed according to the LOESS recipe of Cappellari et al. (2013). The solid black lines show the median metallicity in bins of M⋆, while the dashed magenta lines are the best-fit using the parametrisation proposed in Curti et al. (2020b).
Current usage metrics show cumulative count of Article Views (full-text article views including HTML views, PDF and ePub downloads, according to the available data) and Abstracts Views on Vision4Press platform.
Data correspond to usage on the plateform after 2015. The current usage metrics is available 48-96 hours after online publication and is updated daily on week days.
Initial download of the metrics may take a while.