Fig. 3.
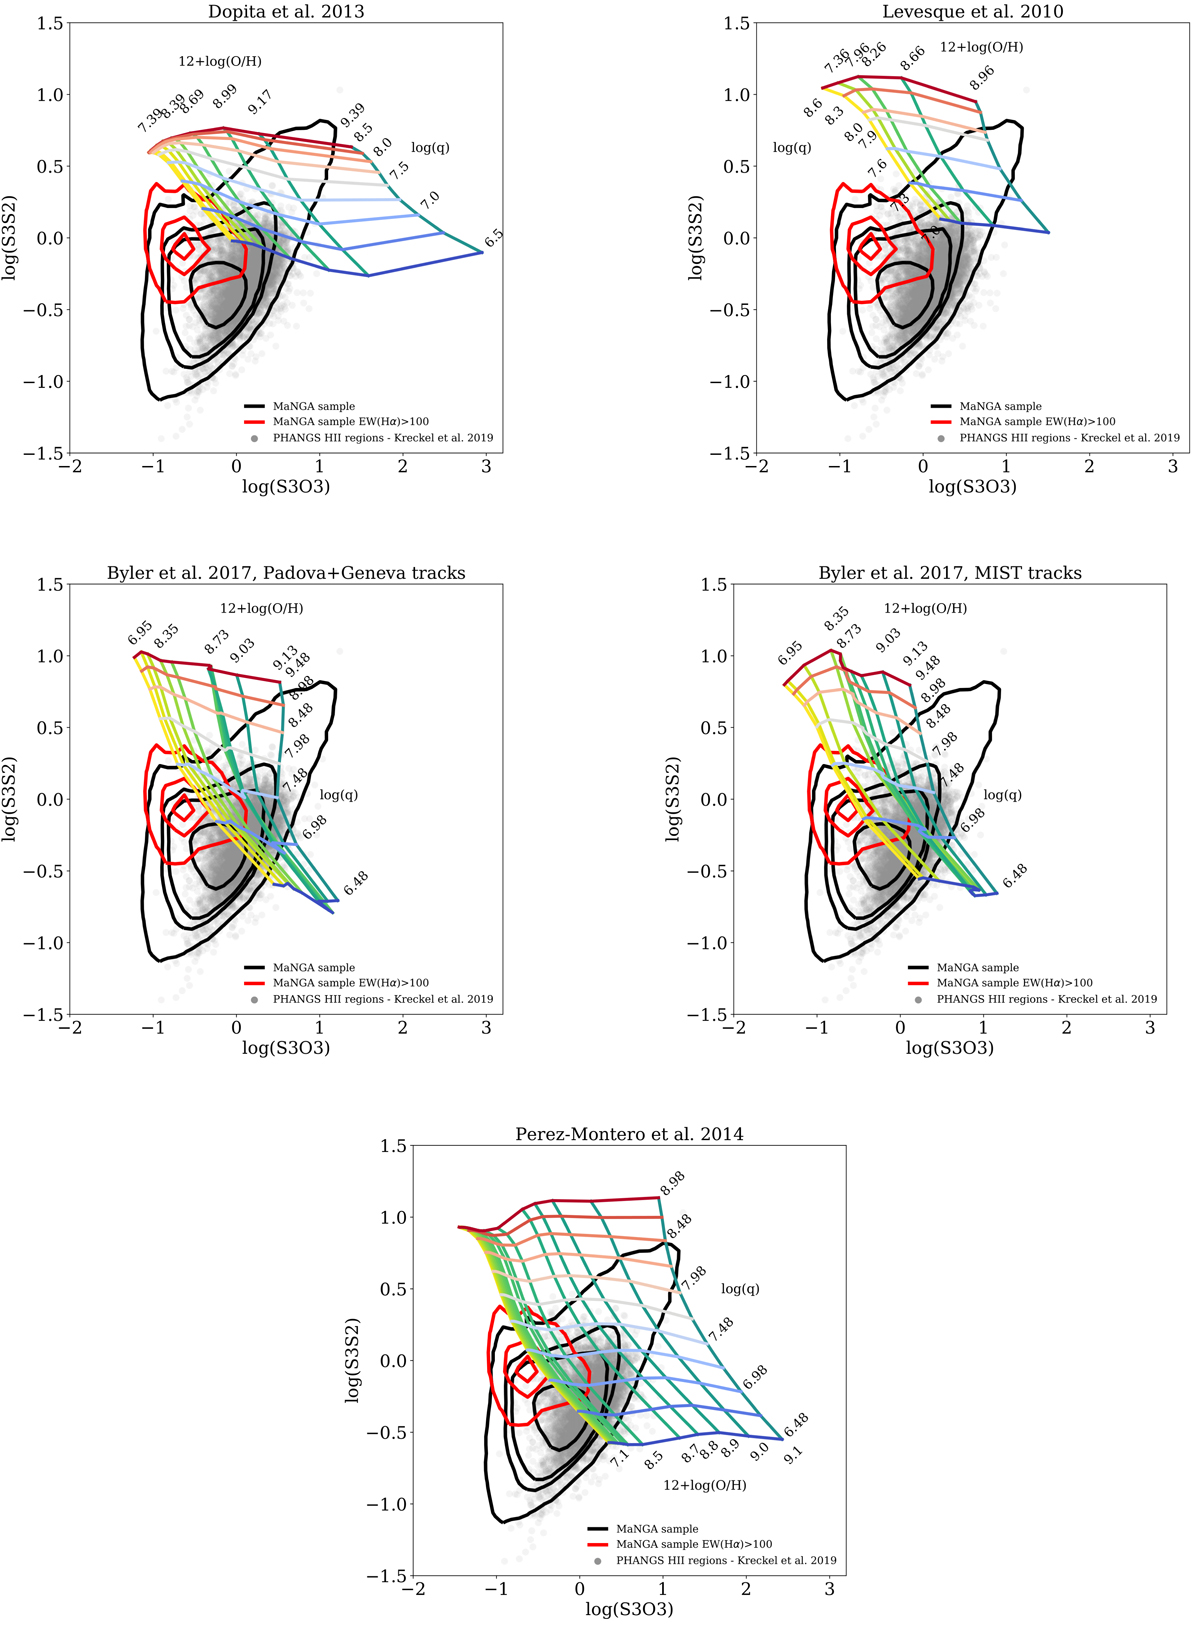
[S III]/[O III] vs. [S III]/[S II] diagnostic diagrams introduced by Stasińska (2006) showing the density contours for all the star-forming spaxels of our sample (in black), with superimposed Dopita et al. (2013), Levesque et al. (2010), Byler et al. (2017) pdva+geneva, Byler et al. (2017) MIST, and Pérez-Montero (2014) models, respectively. Metallicity increases horizontally from yellow to green, while ionisation parameter increases vertically [redder means higher log(q) and bluer lower log(q)]. The red contours correspond to the brighest MaNGA star-forming regions [EW(Hα) > 100], while the grey dots are the H II regions analysed by Kreckel et al. (2019) with the PHANGS survey. Current photoionisation models fail to reproduce the observed [S III] lines.
Current usage metrics show cumulative count of Article Views (full-text article views including HTML views, PDF and ePub downloads, according to the available data) and Abstracts Views on Vision4Press platform.
Data correspond to usage on the plateform after 2015. The current usage metrics is available 48-96 hours after online publication and is updated daily on week days.
Initial download of the metrics may take a while.