Fig. C.1.
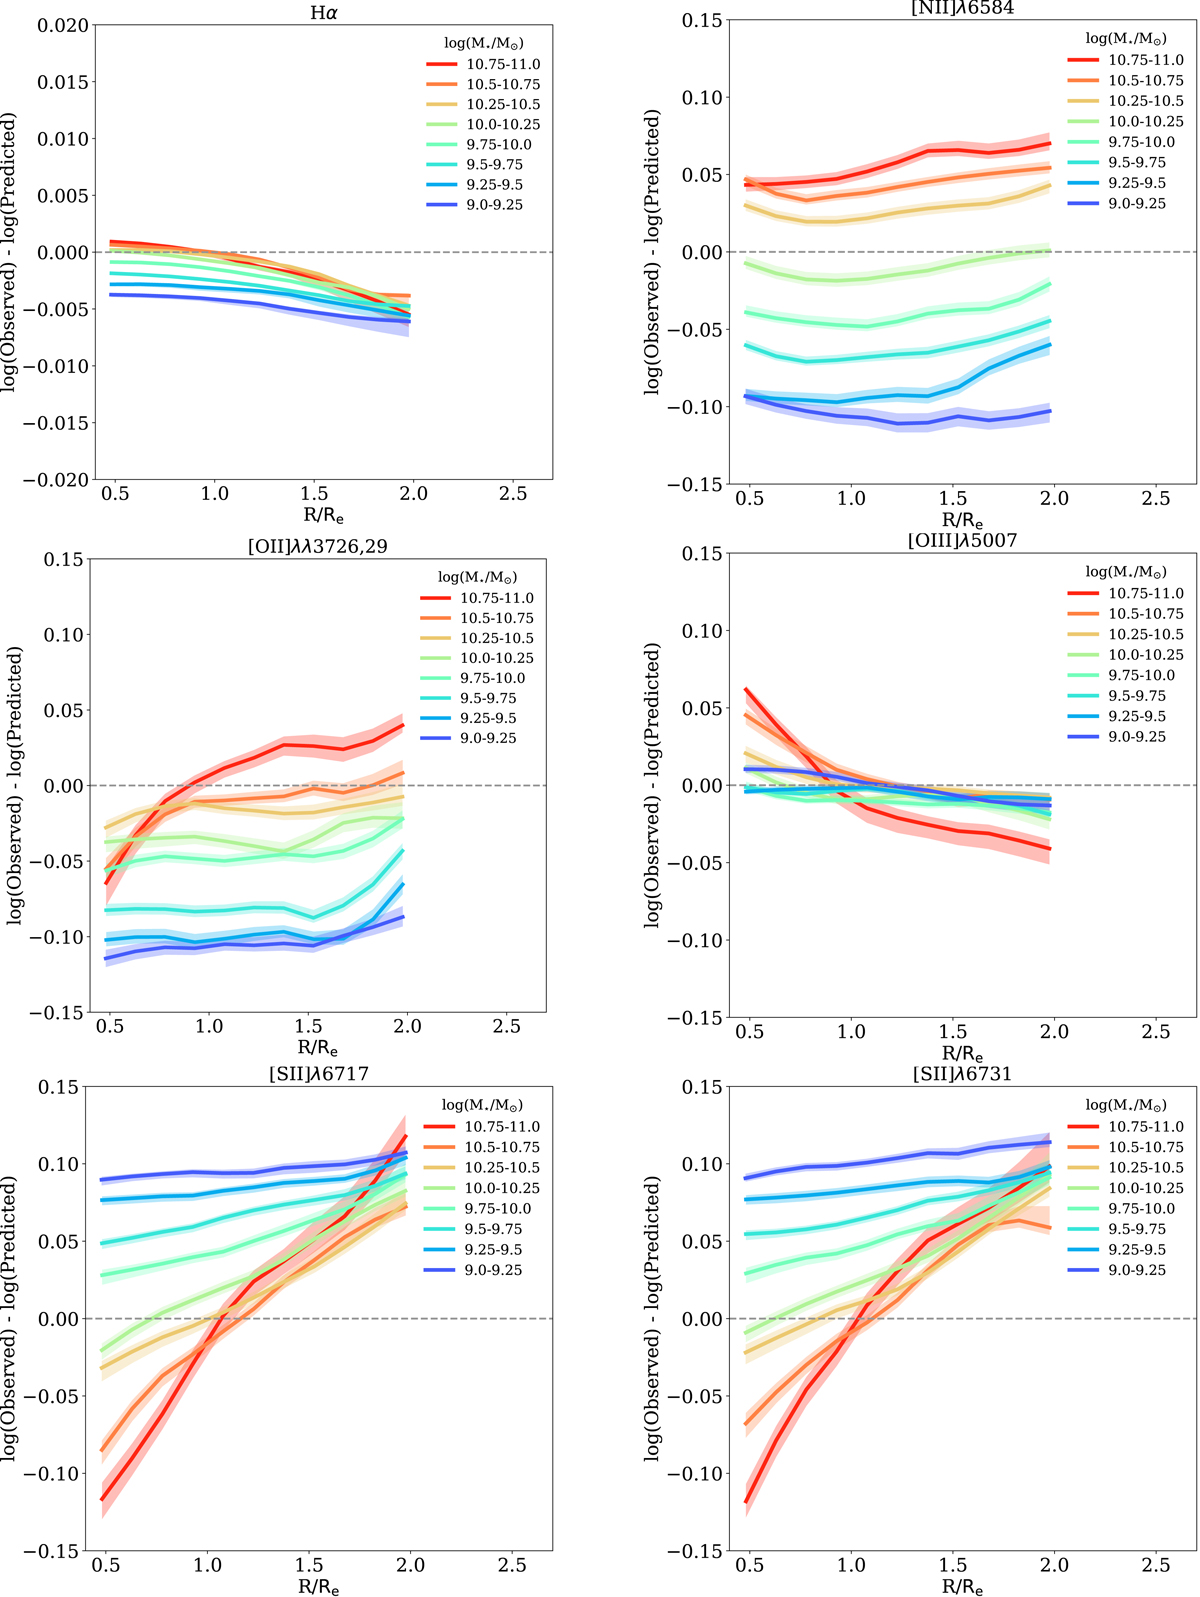
Radial distribution of the difference between the logarithm of the observed flux and that of the best-fit model (both normalised to Hβ) obtained with IZI and a Gaussian prior on the ionisation parameter, for all the emission lines taken into account, in eight stellar mass bins, as reported in the legend. The shaded regions represent the 16th and 84th percentiles of the distribution in each stellar mass bin taking into account the number of galaxies lying in the bin. Since the radial distributions lie in the range [−0.1,0.1] dex, it means that they are all consistent within the intrinsic error taken into account for the models.
Current usage metrics show cumulative count of Article Views (full-text article views including HTML views, PDF and ePub downloads, according to the available data) and Abstracts Views on Vision4Press platform.
Data correspond to usage on the plateform after 2015. The current usage metrics is available 48-96 hours after online publication and is updated daily on week days.
Initial download of the metrics may take a while.