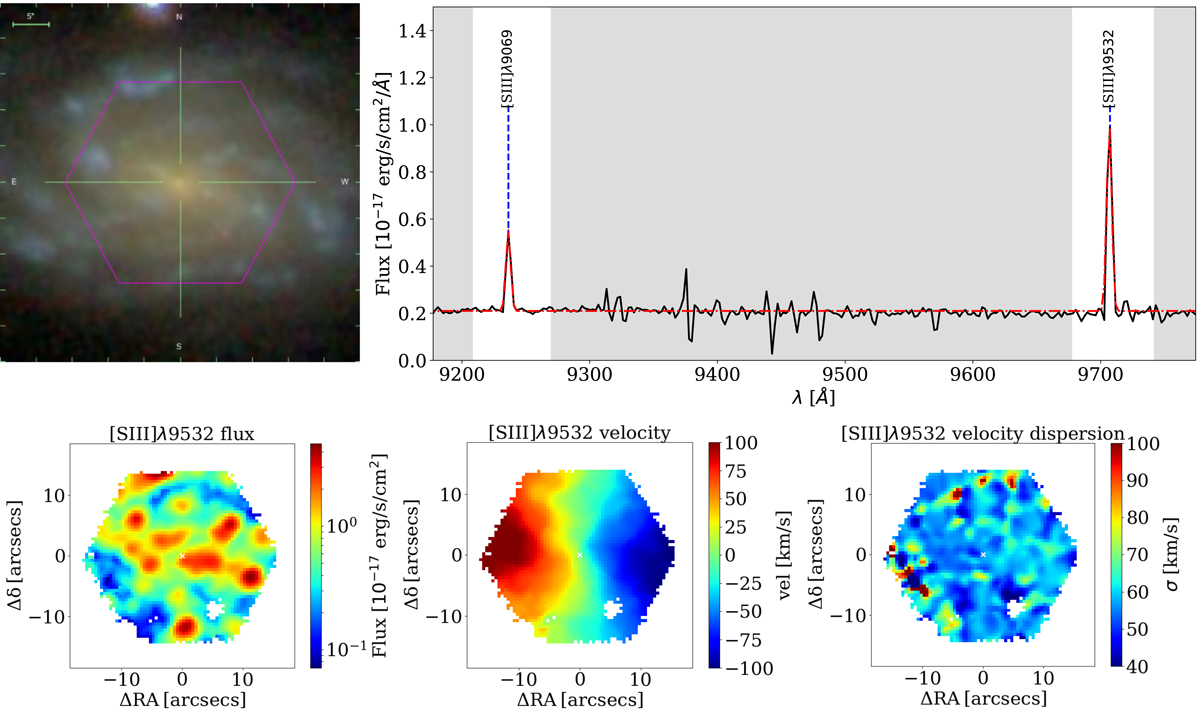
Fig. 1.

Top left: g − r − i image composite from SDSS for MaNGA galaxy 8150−6103, with the MaNGA IFU hexagonal FoV overlaid. East is to the left. Top right: example of our fitting procedure for the [S III] lines for one representative spaxel in this example galaxy. The black solid line is the observed spectrum, while the dashed-dotted red line is the best fit. The regions in grey were masked before fitting. Bottom panels: [S III]λ9532 flux, velocity, and velocity dispersion maps of MaNGA galaxy 8150−6103.
Current usage metrics show cumulative count of Article Views (full-text article views including HTML views, PDF and ePub downloads, according to the available data) and Abstracts Views on Vision4Press platform.
Data correspond to usage on the plateform after 2015. The current usage metrics is available 48-96 hours after online publication and is updated daily on week days.
Initial download of the metrics may take a while.


