Fig. 4.
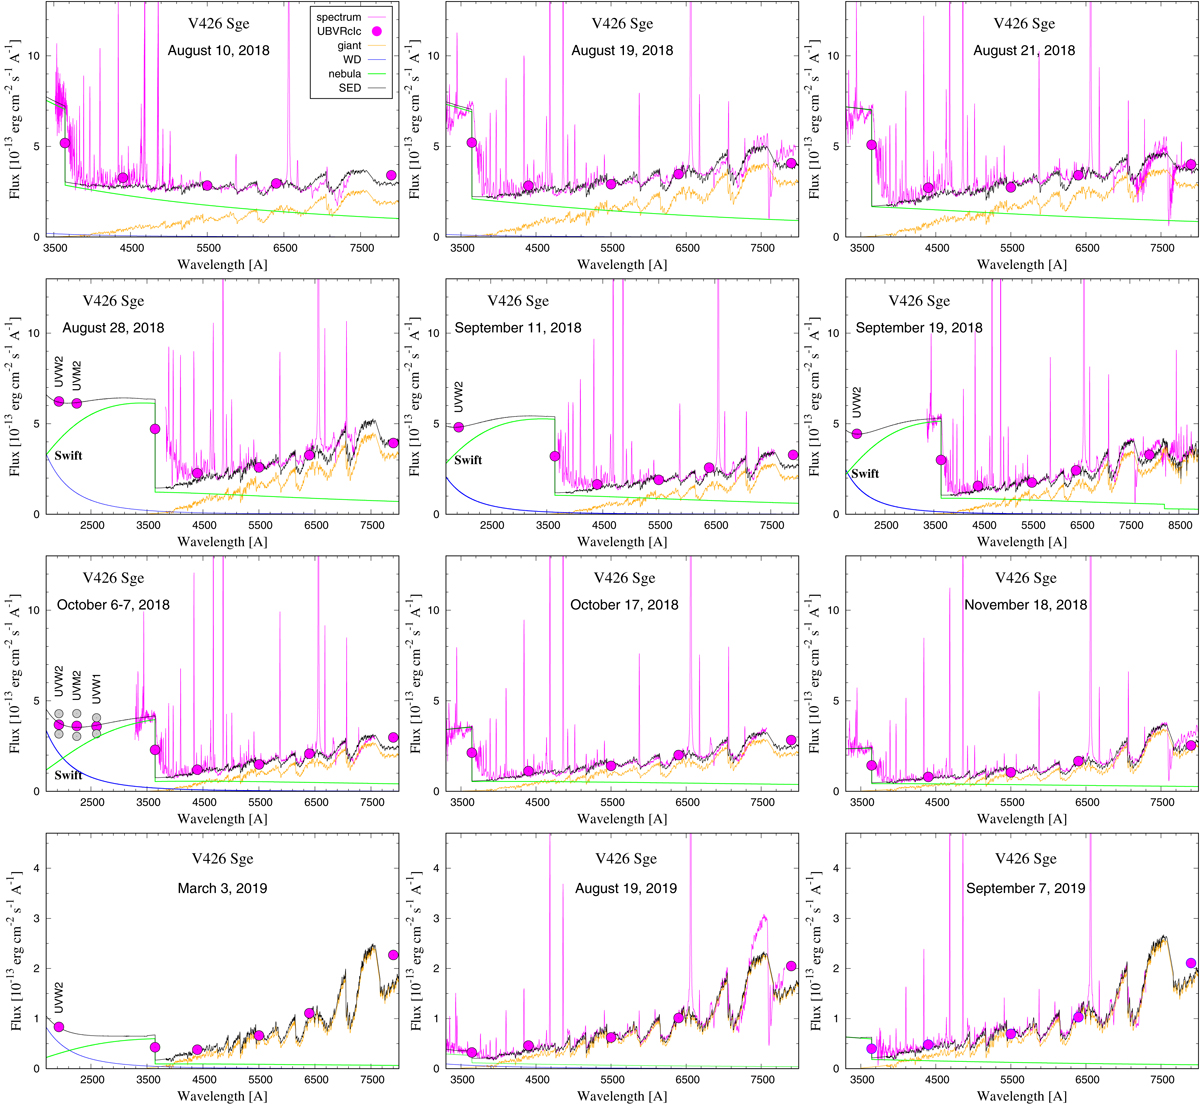
Examples of the observed (in magenta) and modelled (black lines) SEDs of V426 Sge at selected dates during its 2018 outburst and 2019 quiescent phase (bottom row). Lines and symbols are as shown in the keys (top left panel). Grey circles in the panel (3,1) are Swift-UVOT fluxes dereddened with the upper and lower limit of the EB−V excess, 0.22 and 0.18 mag, respectively (see Sect. 3.2.1).
Current usage metrics show cumulative count of Article Views (full-text article views including HTML views, PDF and ePub downloads, according to the available data) and Abstracts Views on Vision4Press platform.
Data correspond to usage on the plateform after 2015. The current usage metrics is available 48-96 hours after online publication and is updated daily on week days.
Initial download of the metrics may take a while.