Fig. 2.
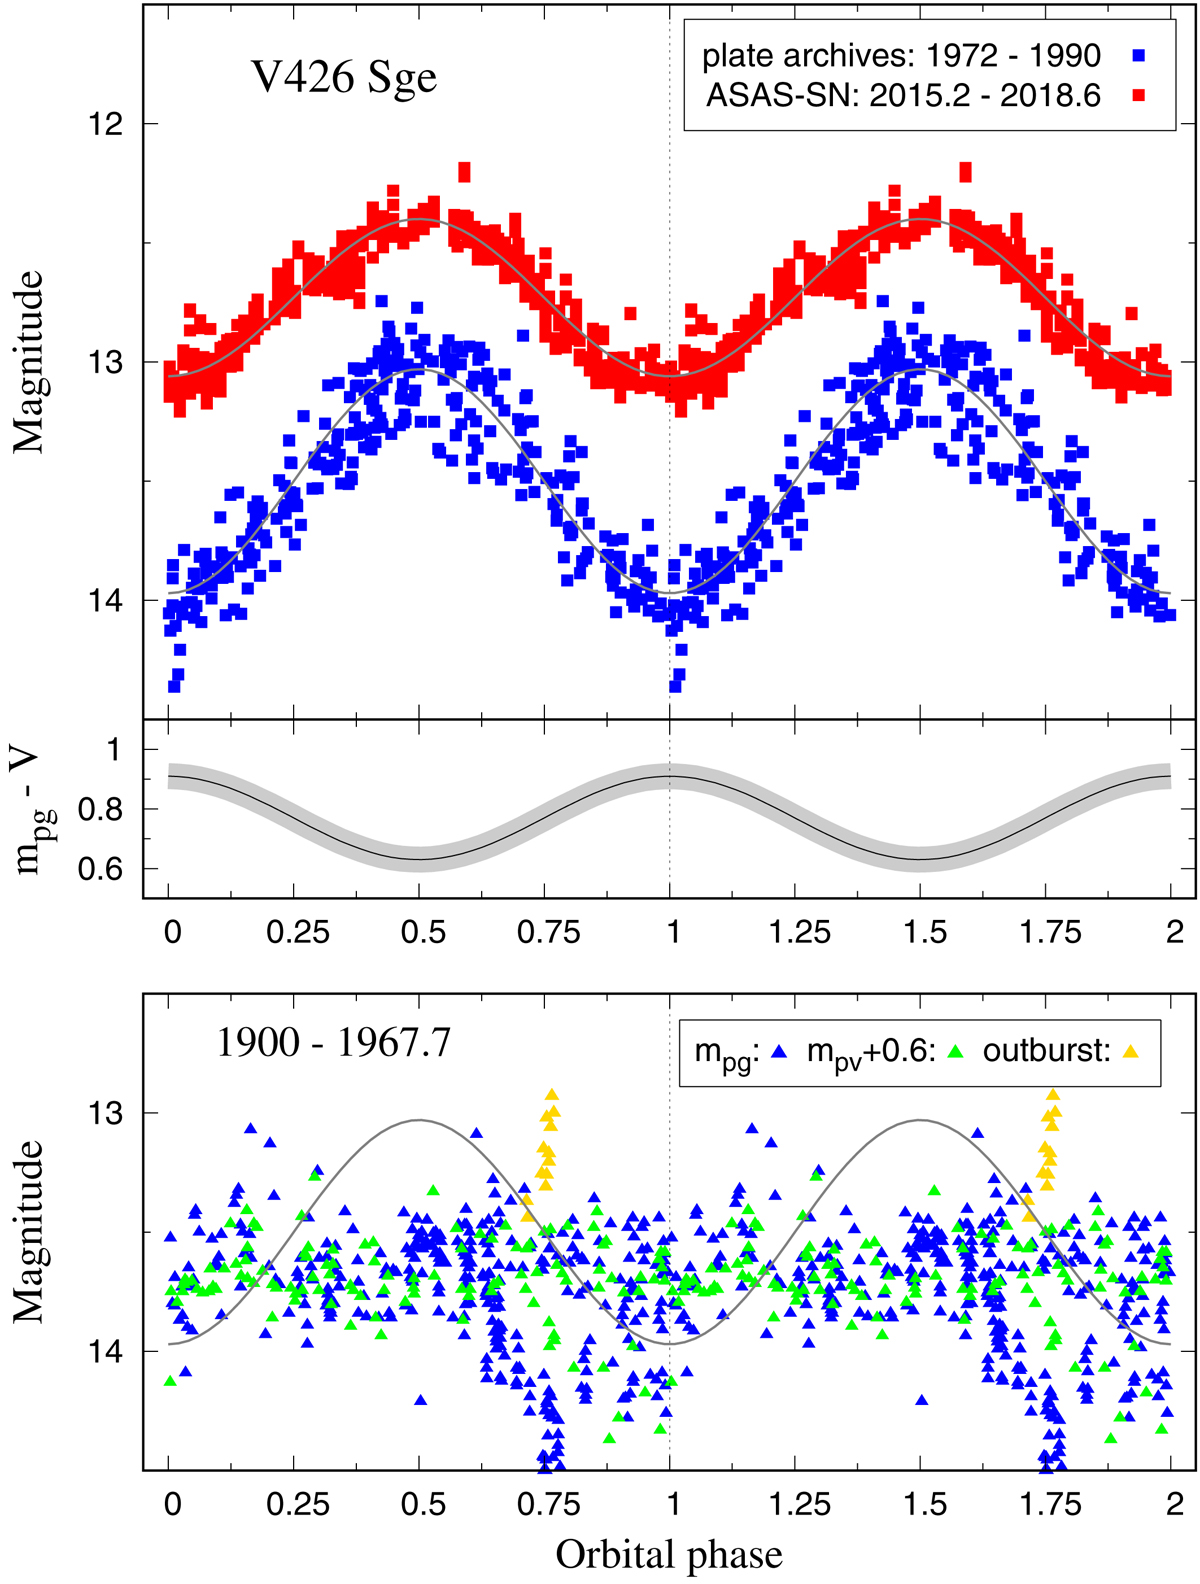
Top: phase diagram for periodic wave-like variations in the ASASSN V and mpg LCs of V426 Sge according to the ephemeris (1). Grey lines represent their sinusoidal fits. Middle: corresponding colour index mpg − V illustrated by the black line inside the grey belt (= its uncertainty) (Sect. 3.1.2). Bottom: photographic magnitudes prior to the 1968 outburst phased with the ephemeris (1). The LCs do not show any sinusoidal light variation along the orbit (Sect. 4.3.1).
Current usage metrics show cumulative count of Article Views (full-text article views including HTML views, PDF and ePub downloads, according to the available data) and Abstracts Views on Vision4Press platform.
Data correspond to usage on the plateform after 2015. The current usage metrics is available 48-96 hours after online publication and is updated daily on week days.
Initial download of the metrics may take a while.