Fig. 12.
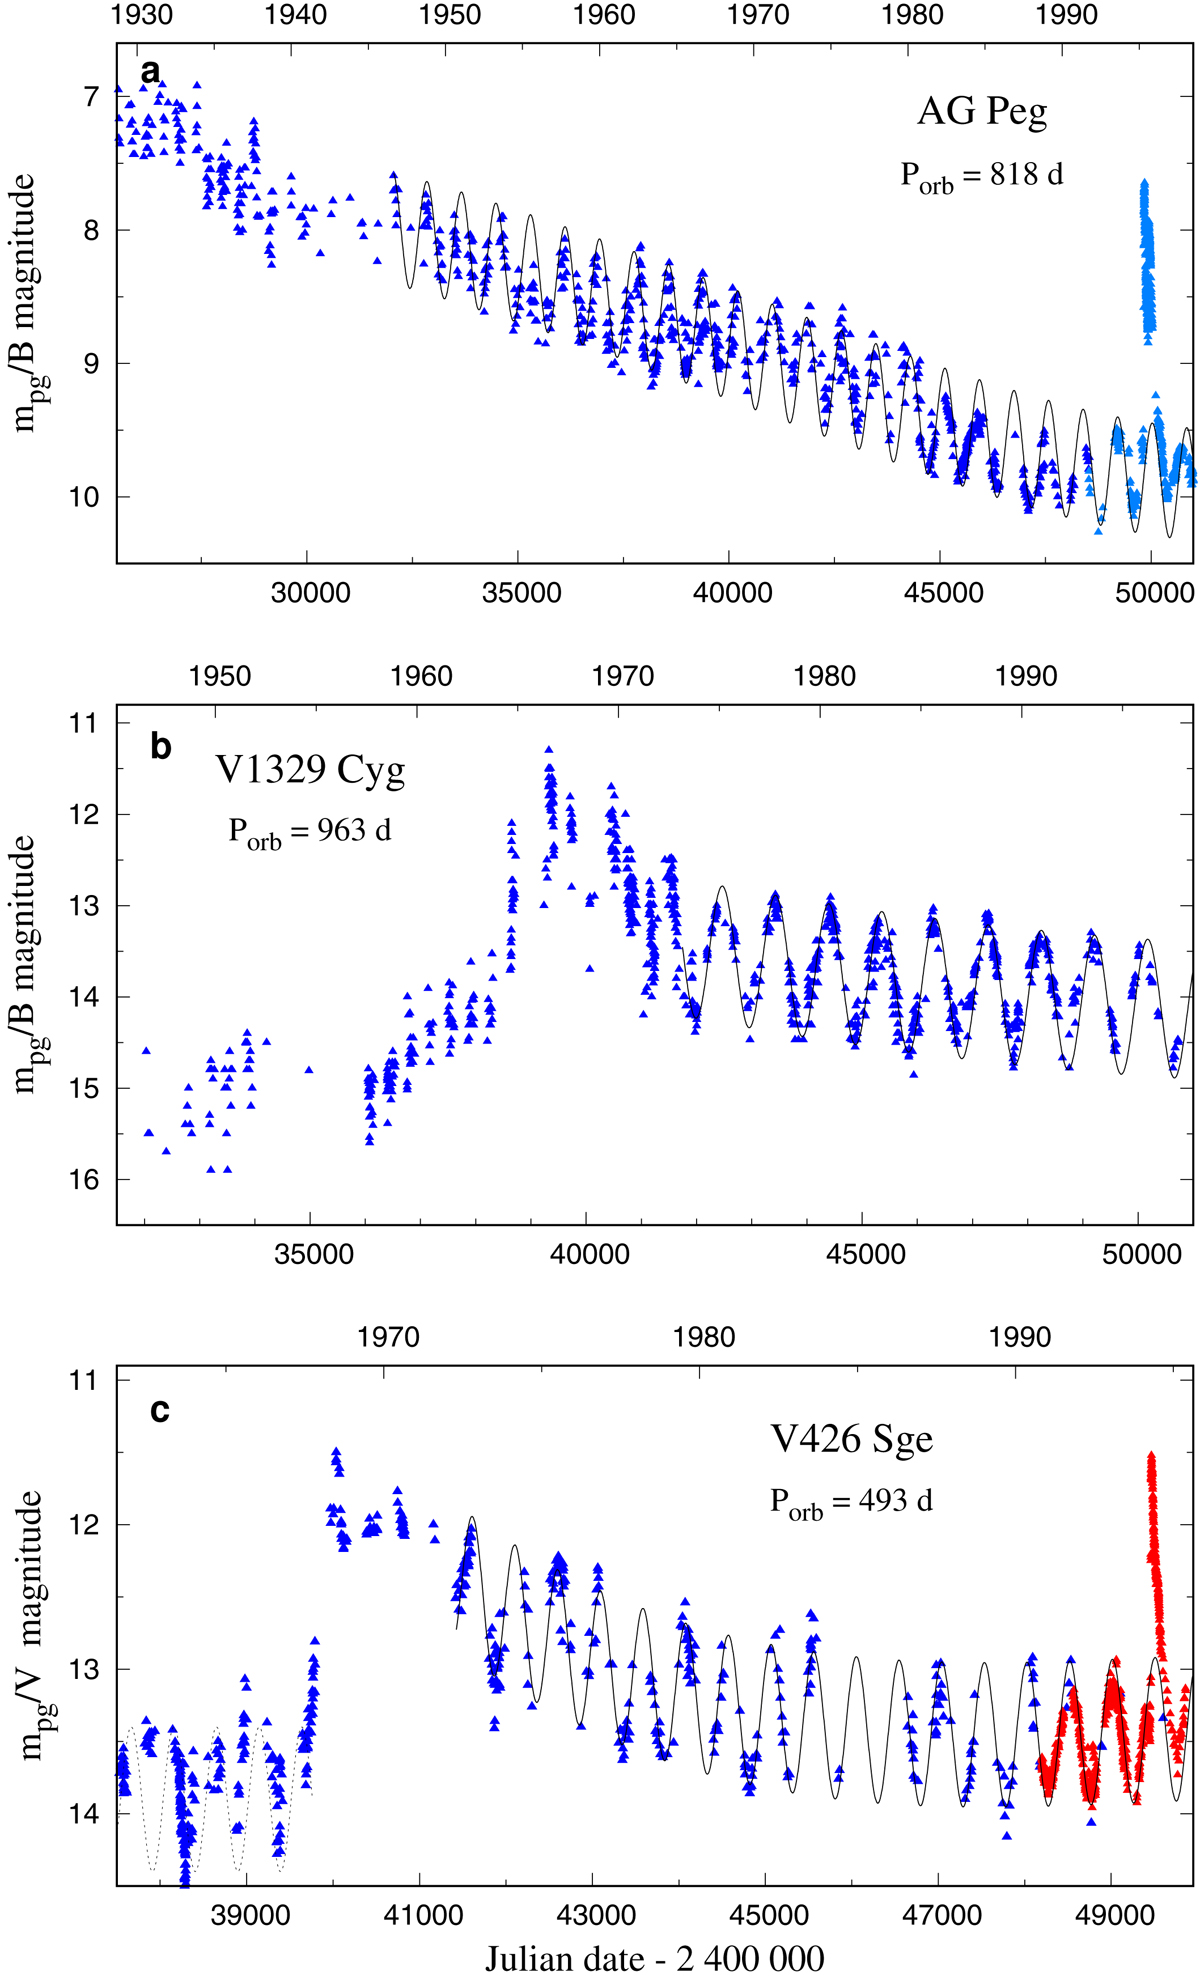
Transition from the symbiotic nova outburst to quiescent phase and eventually to Z And-type outburst for AG Peg, V1329 Cyg, and V426 Sge. The sine curve fits the wave-like orbitally related variation. Panel a: descending part of the historical LC of AG Peg from its 1850 symbiotic nova outburst. The 2015 Z And-type outburst is shifted by −9 × Porb for a better comparison. Data are from Meinunger (1983) and Sekeráš et al. (2019). Panel b: historical LC of V1329 Cyg covering its symbiotic nova outburst around 1965. Data were summarised by Chochol et al. (1999). Panel c: 1968 symbiotic nova outburst (mpg in blue) and the 2018 Z And-type outburst (V in red) of V426 Sge. Data for the latter event are shifted by −18 × Porb and +0.75 mag.
Current usage metrics show cumulative count of Article Views (full-text article views including HTML views, PDF and ePub downloads, according to the available data) and Abstracts Views on Vision4Press platform.
Data correspond to usage on the plateform after 2015. The current usage metrics is available 48-96 hours after online publication and is updated daily on week days.
Initial download of the metrics may take a while.