Fig. 11.
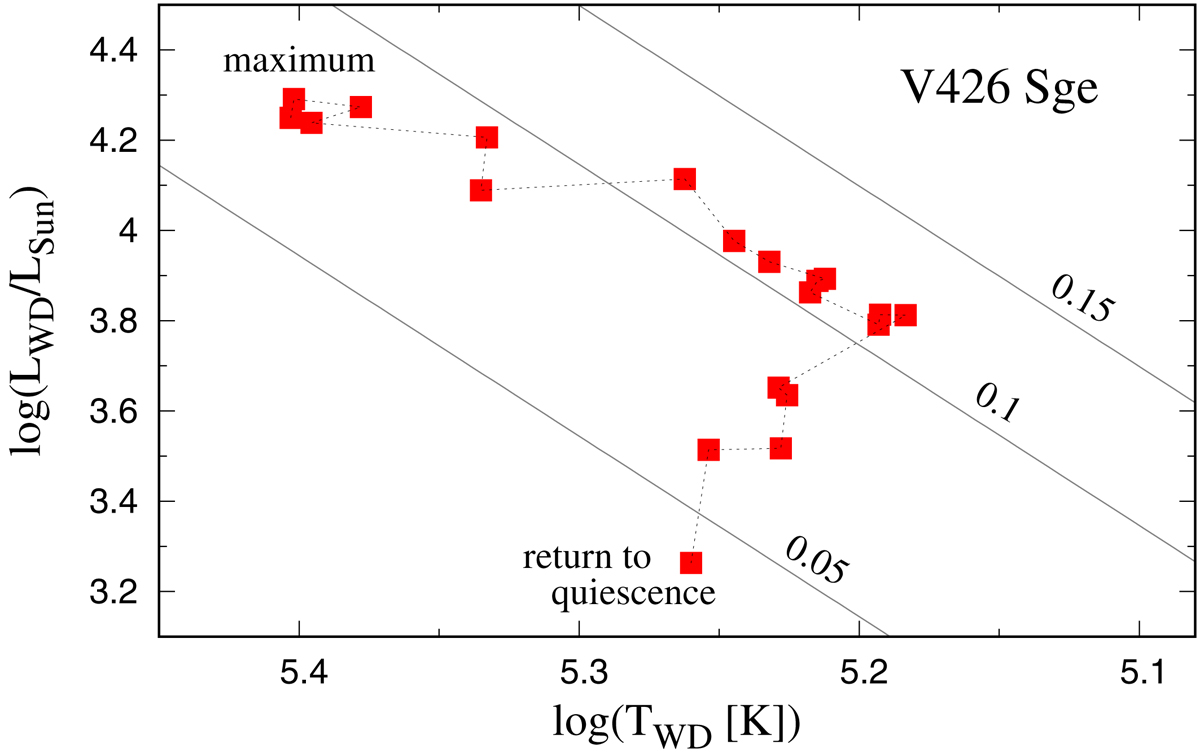
H-R diagram for the 2018 outburst of V426 Sge from around its optical maximum to the return to quiescence as given by our ground-based observations (Table 9). The dotted line follows the temporal evolution of the given parameters. Full lines represent loci with constant effective radii. Labels are in solar units (see Sect. 4.2).
Current usage metrics show cumulative count of Article Views (full-text article views including HTML views, PDF and ePub downloads, according to the available data) and Abstracts Views on Vision4Press platform.
Data correspond to usage on the plateform after 2015. The current usage metrics is available 48-96 hours after online publication and is updated daily on week days.
Initial download of the metrics may take a while.