Fig. 1.
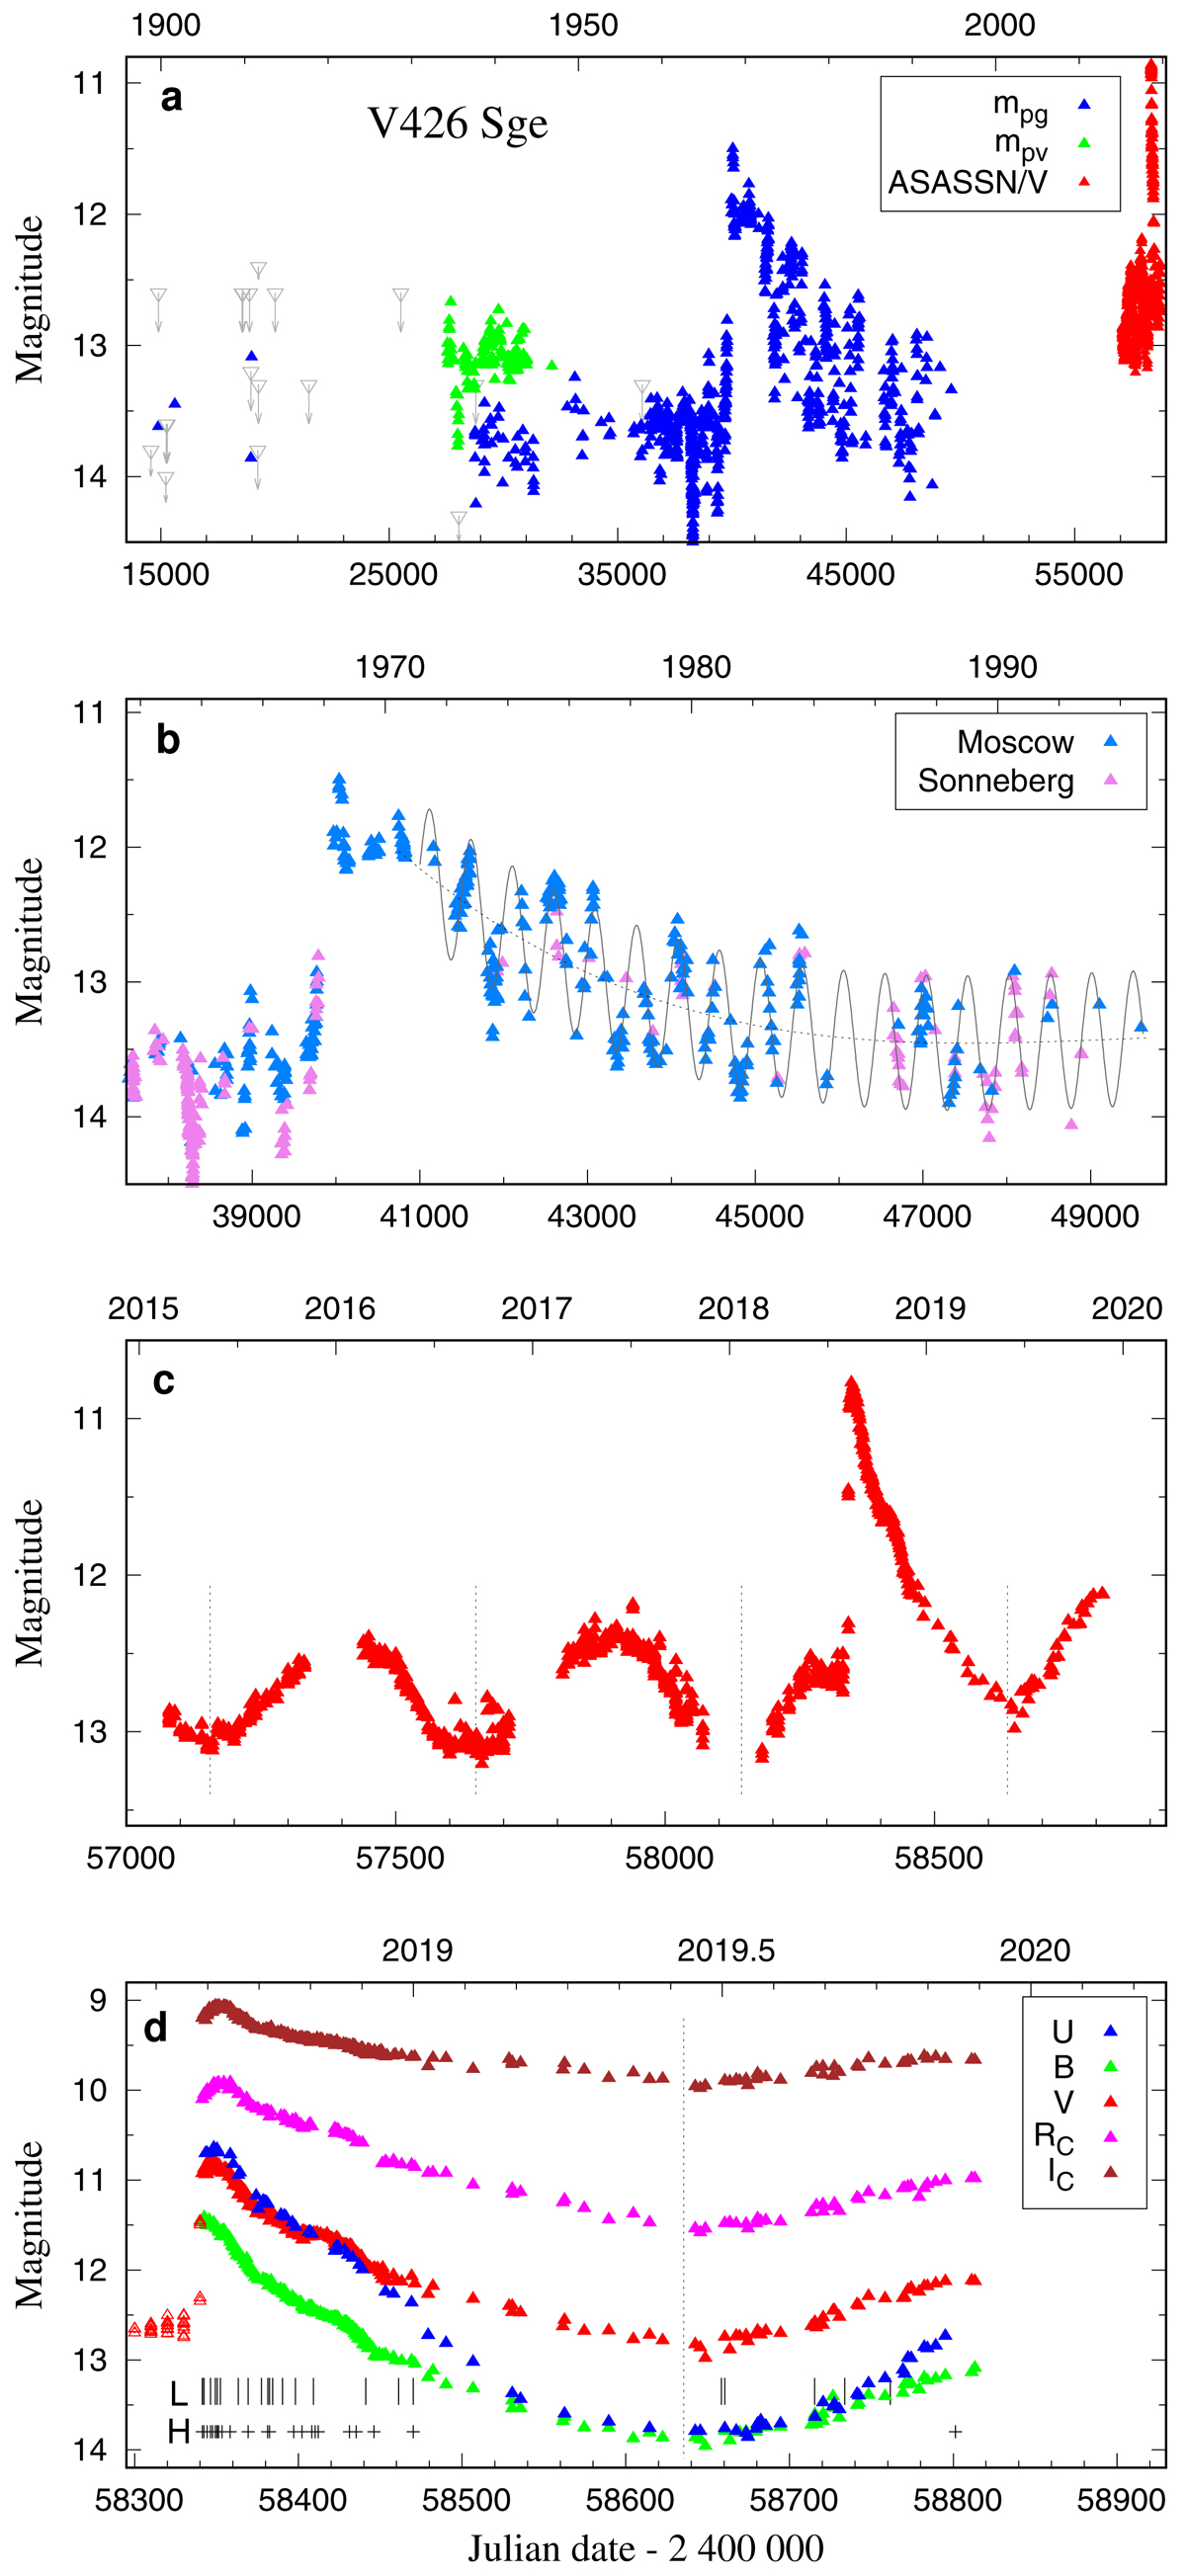
Panel a: historical LC of V426 Sge from 1900 to the present as given by our photographic mpg/mpv magnitudes (blue/green triangles), ASASSN and our V magnitudes (red triangles). Gray triangles with arrows denote a limiting magnitude on plates with unseen target. Panel b: detail of the LC covering the 1968 symbiotic nova outburst. Decline from the maximum and wave-like periodic variation are denoted by the dotted and full line, respectively. Panel c: V-LC from 2015 to the present showing the ASASSN and our data. Panel d: UBVRCIC LCs covering the 2018 outburst and the present quiescence. Vertical bars and crosses denote the dates of our low (L) and high (H) resolution spectra. Dotted vertical lines in panels c and d mark the light minima according to the ephemeris (1).
Current usage metrics show cumulative count of Article Views (full-text article views including HTML views, PDF and ePub downloads, according to the available data) and Abstracts Views on Vision4Press platform.
Data correspond to usage on the plateform after 2015. The current usage metrics is available 48-96 hours after online publication and is updated daily on week days.
Initial download of the metrics may take a while.