Fig. 8
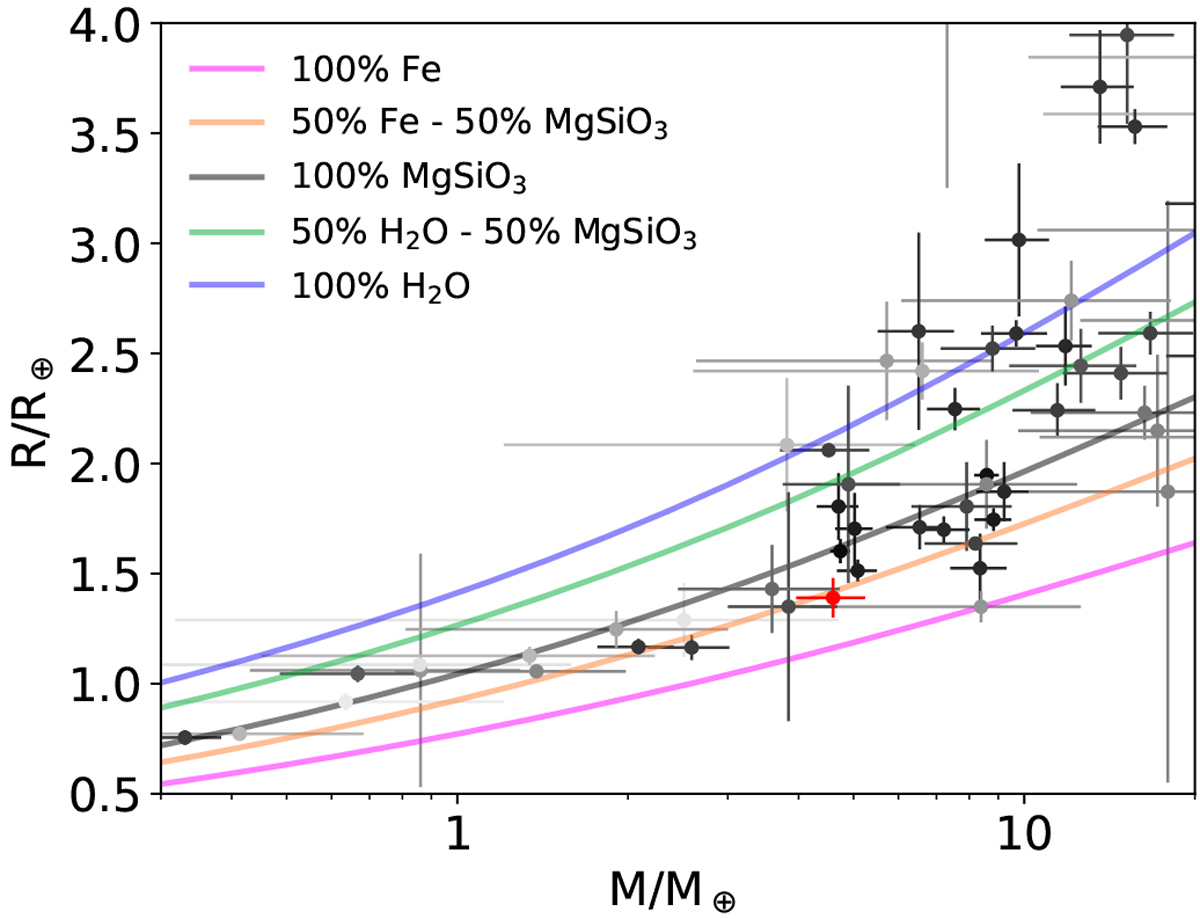
Mass-radius diagram showing L 168-9 b (red circle) in the context of known exoplanets. The transparency of each point is proportional to its associated mass uncertainty. Error bars correspond to 1σ uncertainties. Different models for the bulk composition are plotted where the legend details the fraction of iron, silicates, and/or water for each color-coded curve.
Current usage metrics show cumulative count of Article Views (full-text article views including HTML views, PDF and ePub downloads, according to the available data) and Abstracts Views on Vision4Press platform.
Data correspond to usage on the plateform after 2015. The current usage metrics is available 48-96 hours after online publication and is updated daily on week days.
Initial download of the metrics may take a while.