Fig. 6
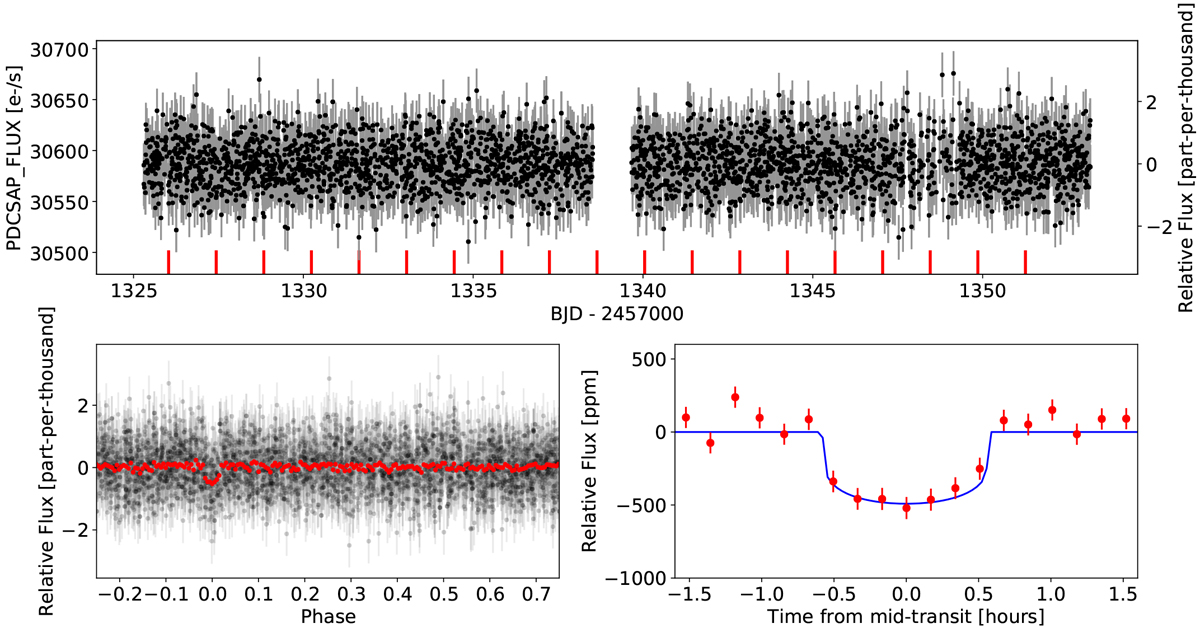
Time series of TESS data for L 168-9. One fifth of original data are plotted for visualization purposes. Upper panel: detrended TESS light curve. Red vertical bars represent the transits of the planet candidate. Bottom panel: phase folded normalized photometry. Red points correspond to binned data for illustrative purposes. The entire orbital phase is shown to the left, while the right presents the transit phase as well as the best transit model whose parameters come from the Table 2.
Current usage metrics show cumulative count of Article Views (full-text article views including HTML views, PDF and ePub downloads, according to the available data) and Abstracts Views on Vision4Press platform.
Data correspond to usage on the plateform after 2015. The current usage metrics is available 48-96 hours after online publication and is updated daily on week days.
Initial download of the metrics may take a while.