Fig. 5
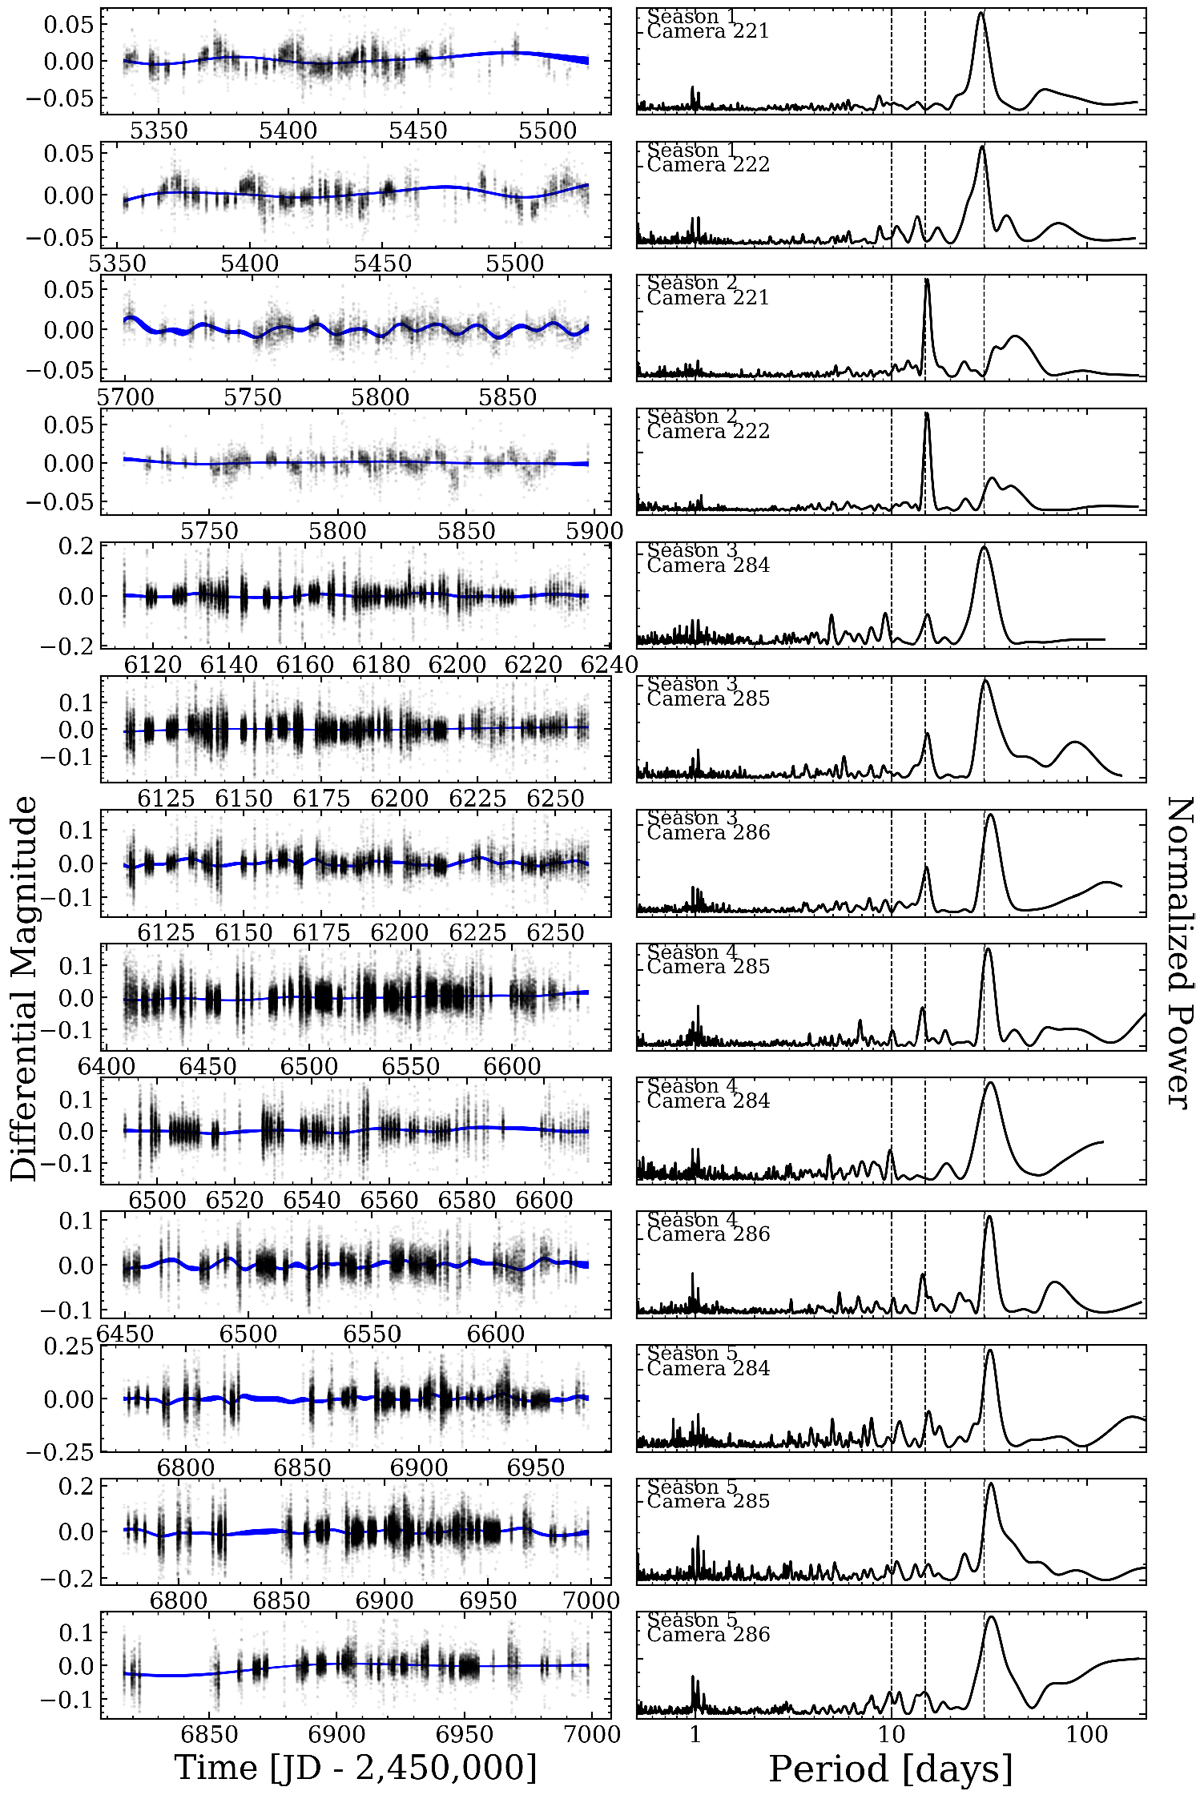
WASP photometry. Left column: photometry time series; the blue shaded regions depict ± 1σ about the mean GP regression model of the binned photo- metry. Right column: generalized Lomb-Scargle periodogram of each season highlights the prevalence of photometric variations close to the measured rotation period and/or its first and second harmonics (vertical dashed lines).
Current usage metrics show cumulative count of Article Views (full-text article views including HTML views, PDF and ePub downloads, according to the available data) and Abstracts Views on Vision4Press platform.
Data correspond to usage on the plateform after 2015. The current usage metrics is available 48-96 hours after online publication and is updated daily on week days.
Initial download of the metrics may take a while.