Fig. 4
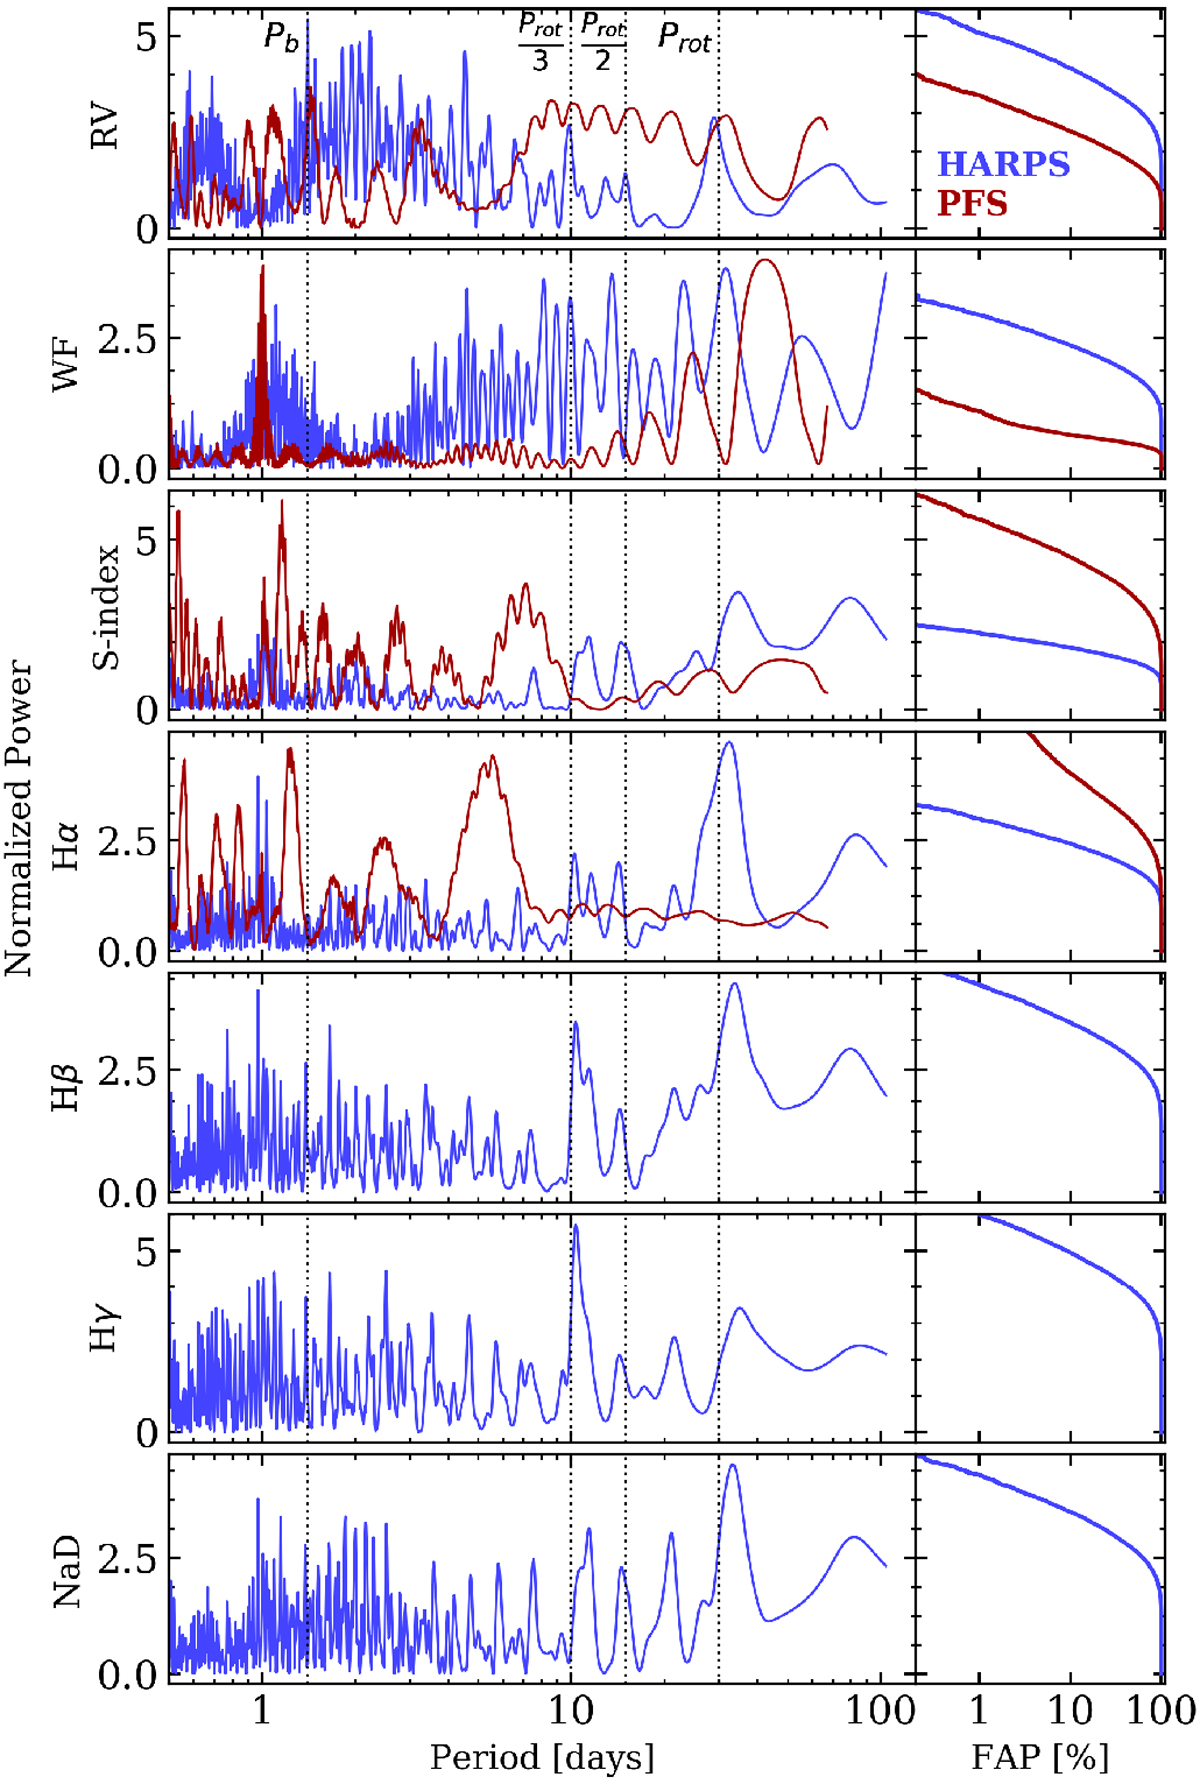
Left column: generalized Lomb-Scargle periodograms of the HARPS and PFS RV time series, window functions, and the S-index, Hα, Hβ, Hγ, and sodium doublet activity indicators. The vertical dotted lines highlight the locations of the L 168-9 b orbital period, the stellar rotation period, and its first two harmonics. Right column: false alarm probabilities were computed from bootstrapping with replacement.
Current usage metrics show cumulative count of Article Views (full-text article views including HTML views, PDF and ePub downloads, according to the available data) and Abstracts Views on Vision4Press platform.
Data correspond to usage on the plateform after 2015. The current usage metrics is available 48-96 hours after online publication and is updated daily on week days.
Initial download of the metrics may take a while.