Fig. 6
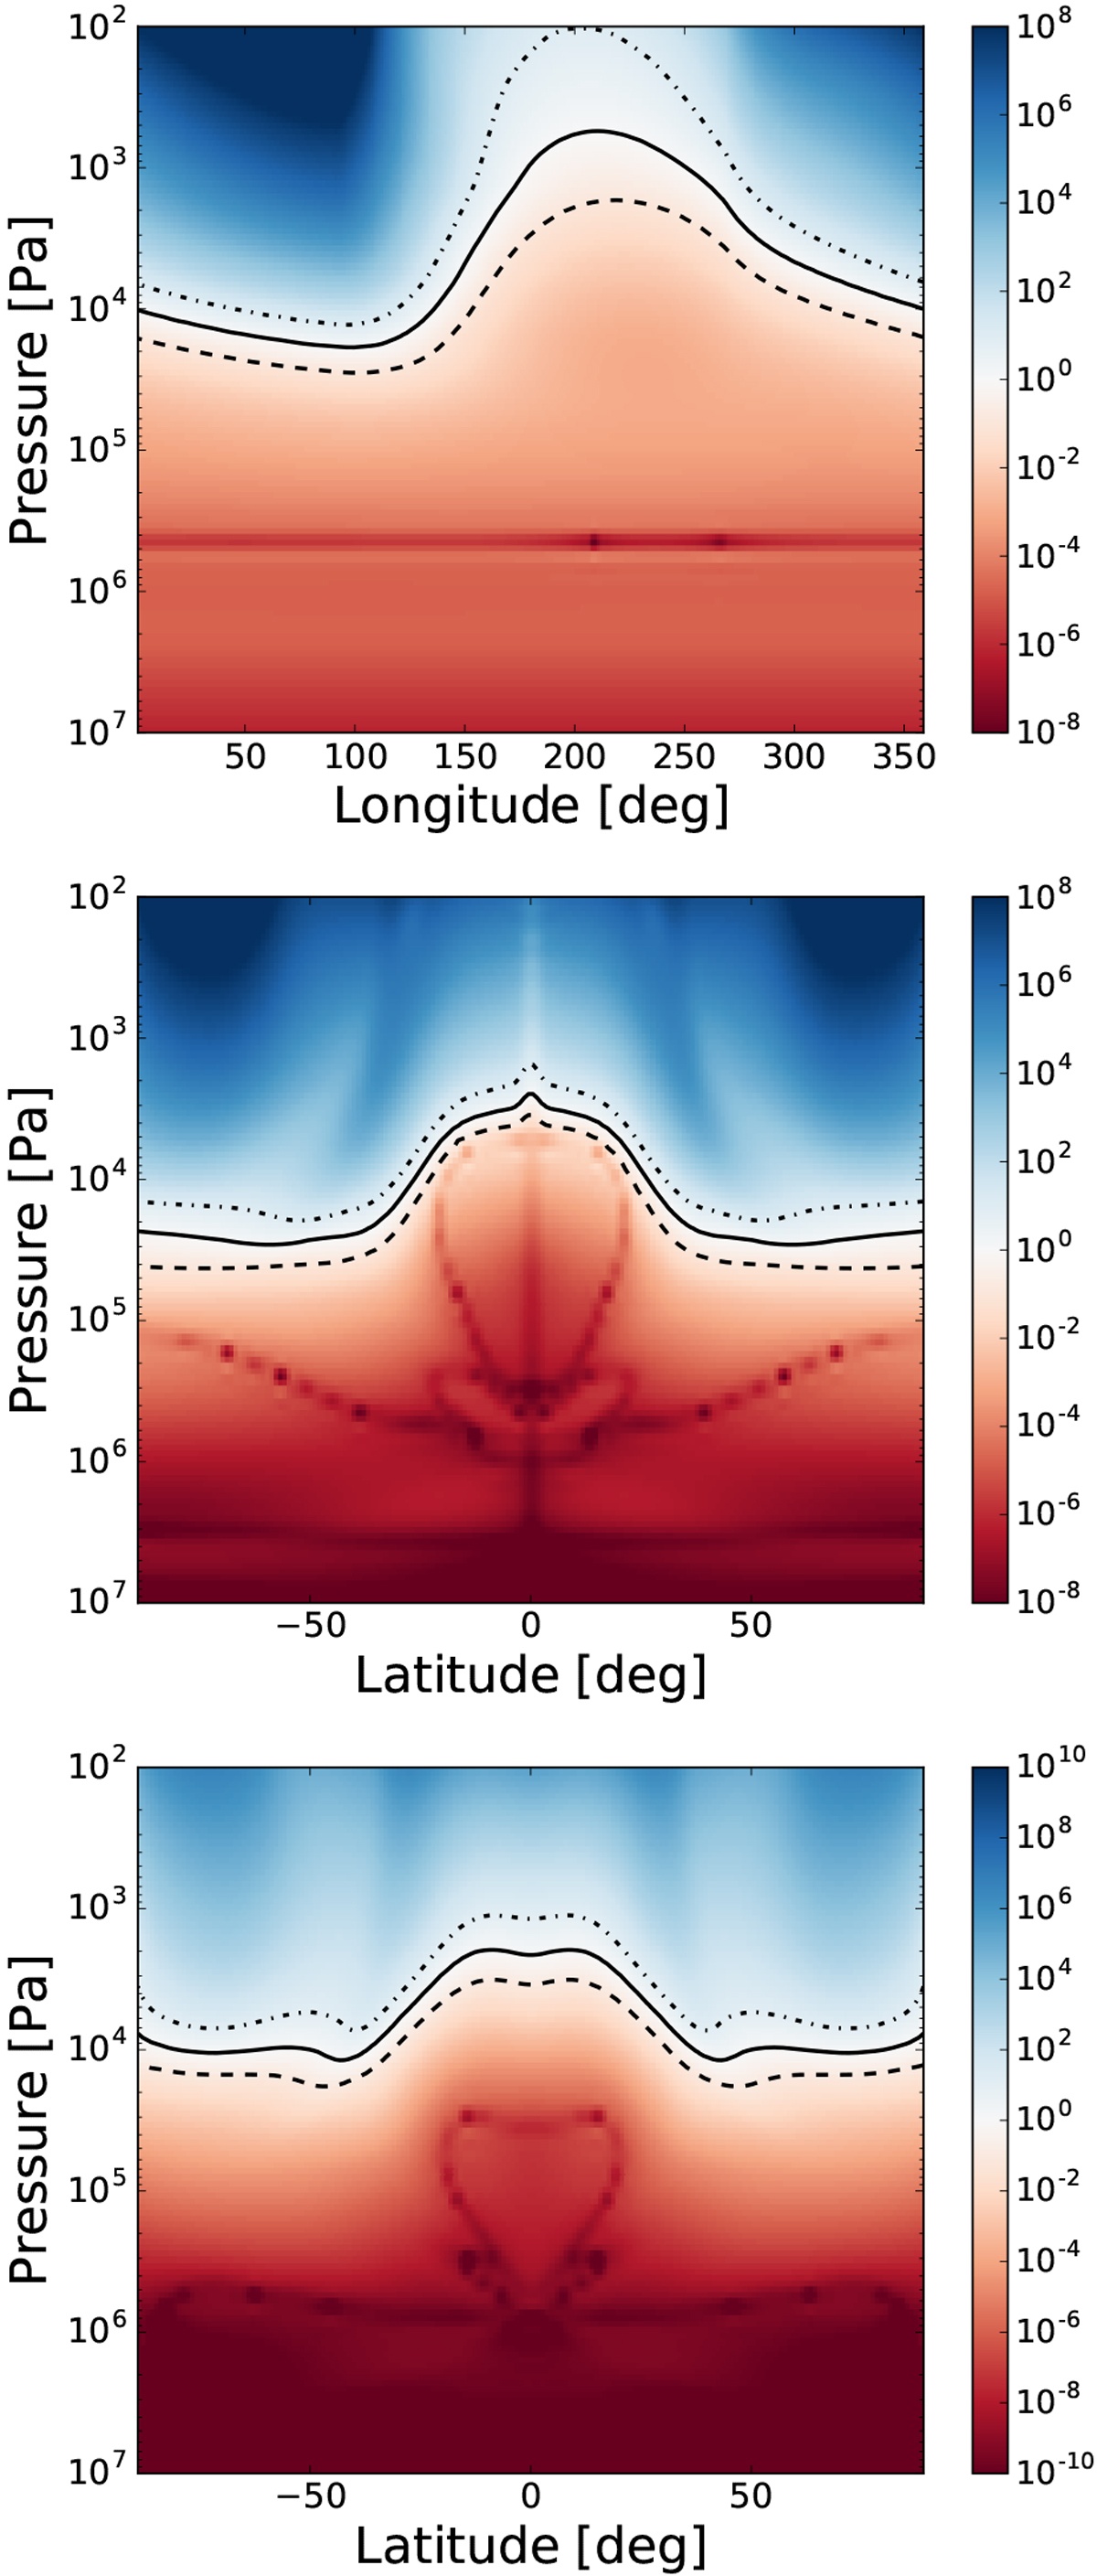
Ratios of the chemical to advection timescales for CH4 (α = τchem∕τadv), for the zonal (top), meridional (middle), and vertical (bottom) components of the wind for the kinetics simulation of HD 209458b. We show a meridional-mean between ± 30° latitude for the zonal component, and slices at a longitude of 0° (i.e. the antistellar point) for the meridional and vertical components. The colour scale shows α, with blue colours corresponding to α > 1 and red colours corresponding to α < 1. The black contours show the α = 0.1, 1, 10 values. The fine structure shown in the plots is a reflection of regions where the wind velocity changes signs (e.g. eastward to westward) and the wind velocity approaches a value of zero over a very small region at the transition.
Current usage metrics show cumulative count of Article Views (full-text article views including HTML views, PDF and ePub downloads, according to the available data) and Abstracts Views on Vision4Press platform.
Data correspond to usage on the plateform after 2015. The current usage metrics is available 48-96 hours after online publication and is updated daily on week days.
Initial download of the metrics may take a while.