Fig. 3
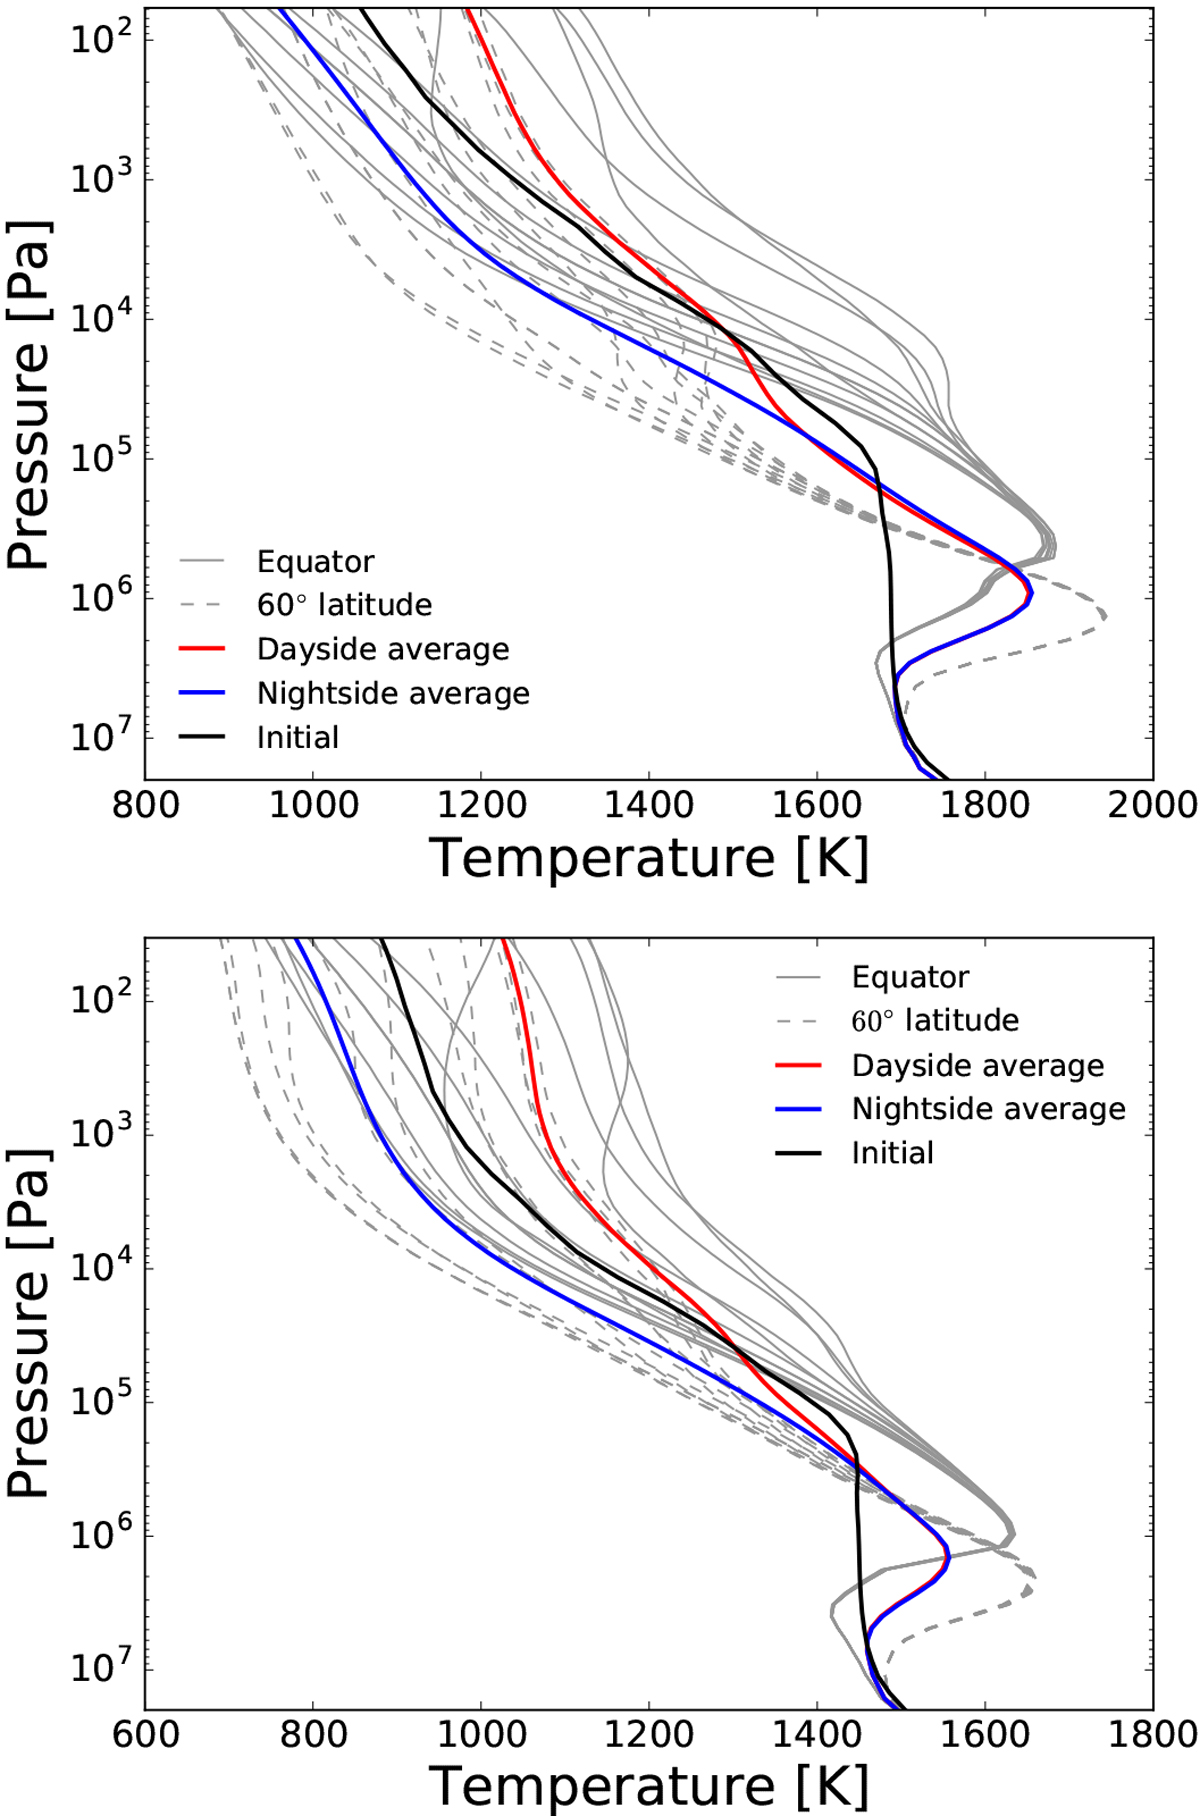
Pressure-temperature profiles extracted from the 3D grid of equilibrium simulations of HD 209458b (top) and HD 189733b (bottom). Solid grey lines show profiles at various longitude points around the equator (0° latitude) while dashed grey lines show profiles at various longitude points at a latitude of 60°. Area-weighted dayside average (red) and nightside average (blue) profiles are shown, along with the 1D radiative-convective equilibrium model profile used to initialise the 3D model (black).
Current usage metrics show cumulative count of Article Views (full-text article views including HTML views, PDF and ePub downloads, according to the available data) and Abstracts Views on Vision4Press platform.
Data correspond to usage on the plateform after 2015. The current usage metrics is available 48-96 hours after online publication and is updated daily on week days.
Initial download of the metrics may take a while.