Free Access
Fig. 14
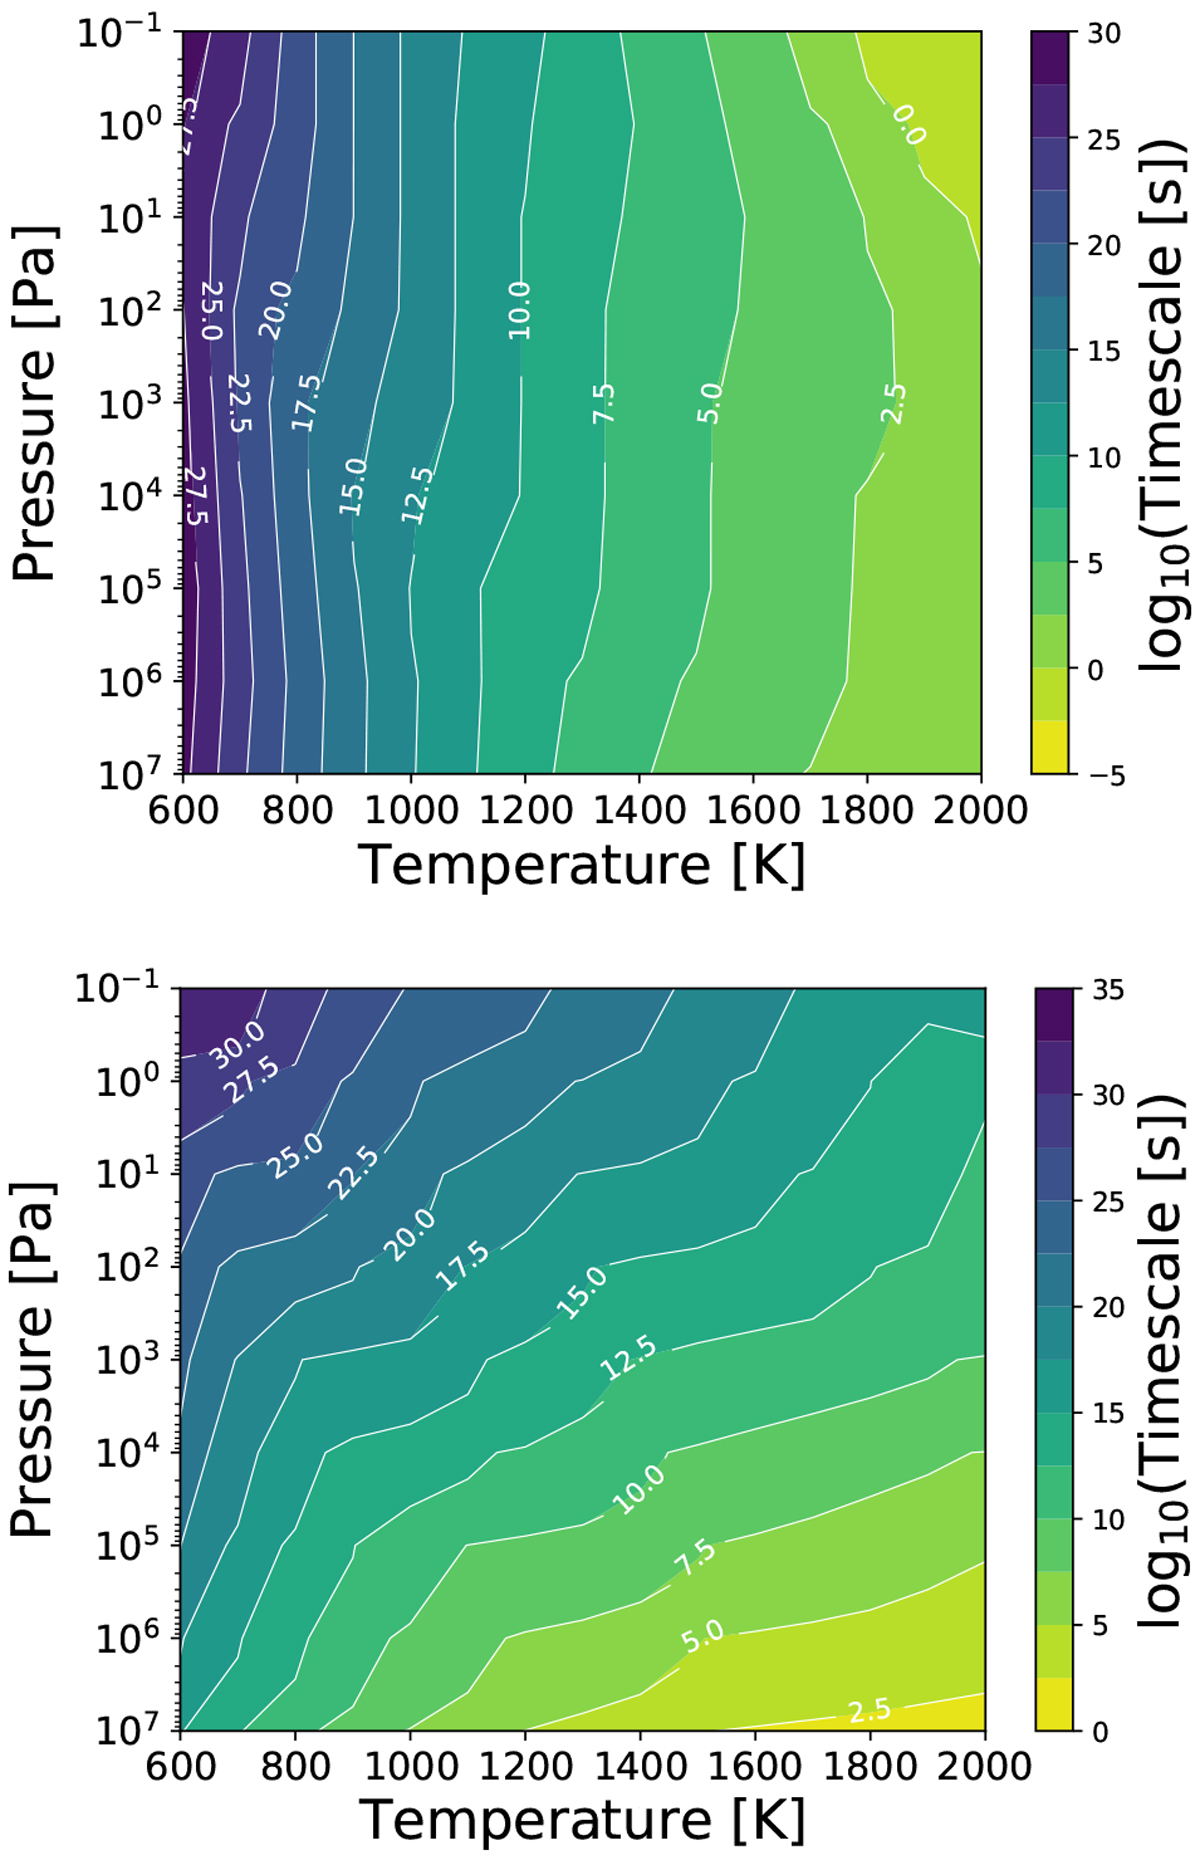
Chemical timescales of CH4 (top) and CO (bottom) estimated for the Venot et al. (2019) chemical network as a function of pressure (in bar, y-axis) and temperature (in K, x-axis). The quantity shown is the common logarithm of the timescale in seconds. The colourscales are different between the two panels.
Current usage metrics show cumulative count of Article Views (full-text article views including HTML views, PDF and ePub downloads, according to the available data) and Abstracts Views on Vision4Press platform.
Data correspond to usage on the plateform after 2015. The current usage metrics is available 48-96 hours after online publication and is updated daily on week days.
Initial download of the metrics may take a while.