Free Access
Fig. 10
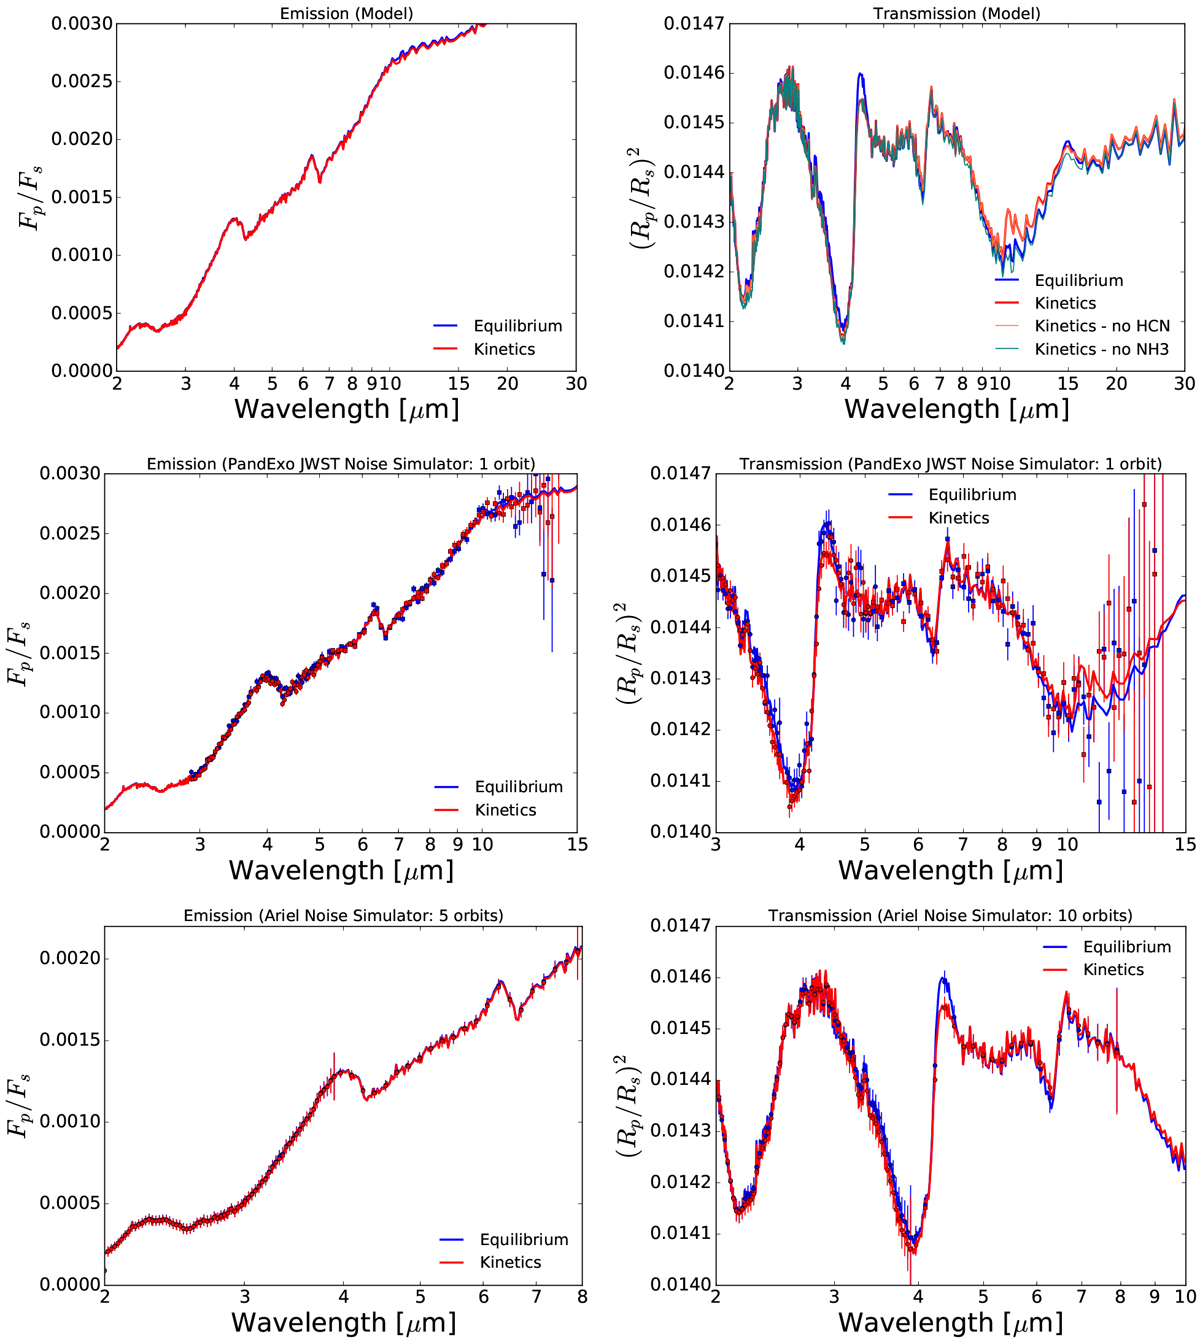
Transmission (left) and emission (right) spectra for the equilibrium (blue) and kinetics (red) simulations of HD 209458b. Top row: model spectra, middle row: simulated JWST observations and bottom row: simulated ARIEL observations.
Current usage metrics show cumulative count of Article Views (full-text article views including HTML views, PDF and ePub downloads, according to the available data) and Abstracts Views on Vision4Press platform.
Data correspond to usage on the plateform after 2015. The current usage metrics is available 48-96 hours after online publication and is updated daily on week days.
Initial download of the metrics may take a while.