Free Access
Fig. 3.
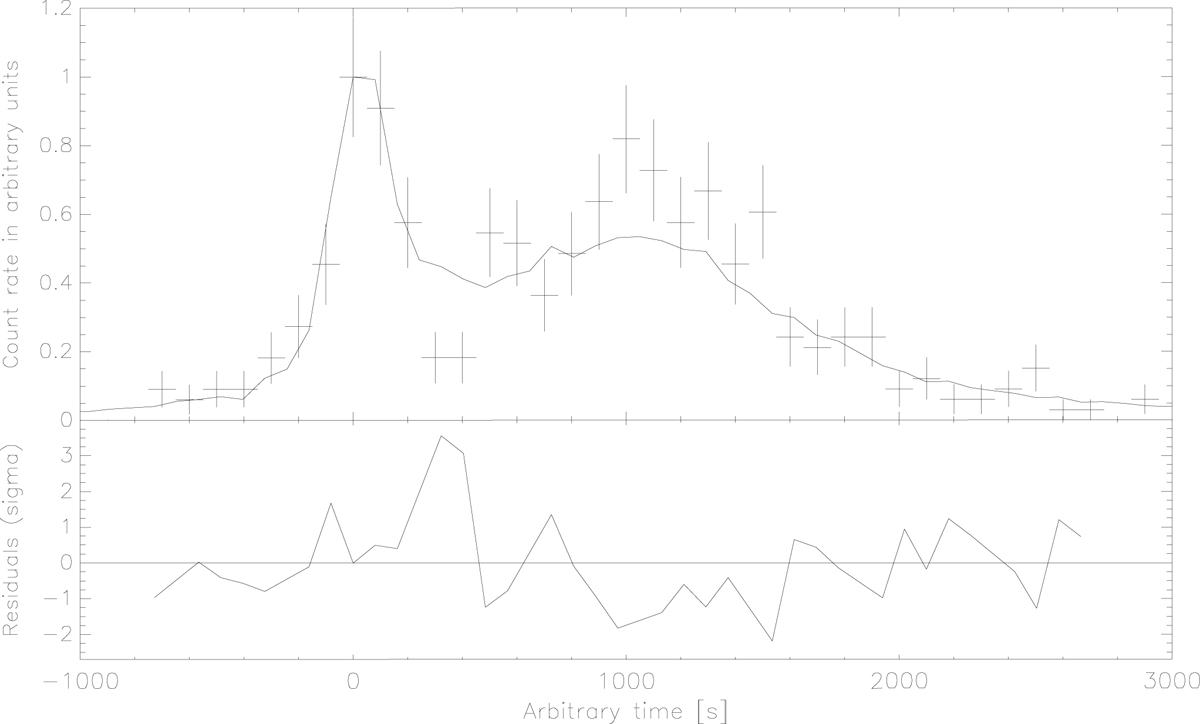
Best-fitting hotspot model (solid line) applied to the flare light curve (crosses) observed by Chandra on 2018 April 24. The time bin of the observed light curve is 100 s. Bottom panel: residuals in units of σ.
Current usage metrics show cumulative count of Article Views (full-text article views including HTML views, PDF and ePub downloads, according to the available data) and Abstracts Views on Vision4Press platform.
Data correspond to usage on the plateform after 2015. The current usage metrics is available 48-96 hours after online publication and is updated daily on week days.
Initial download of the metrics may take a while.