Free Access
Fig. D.1.
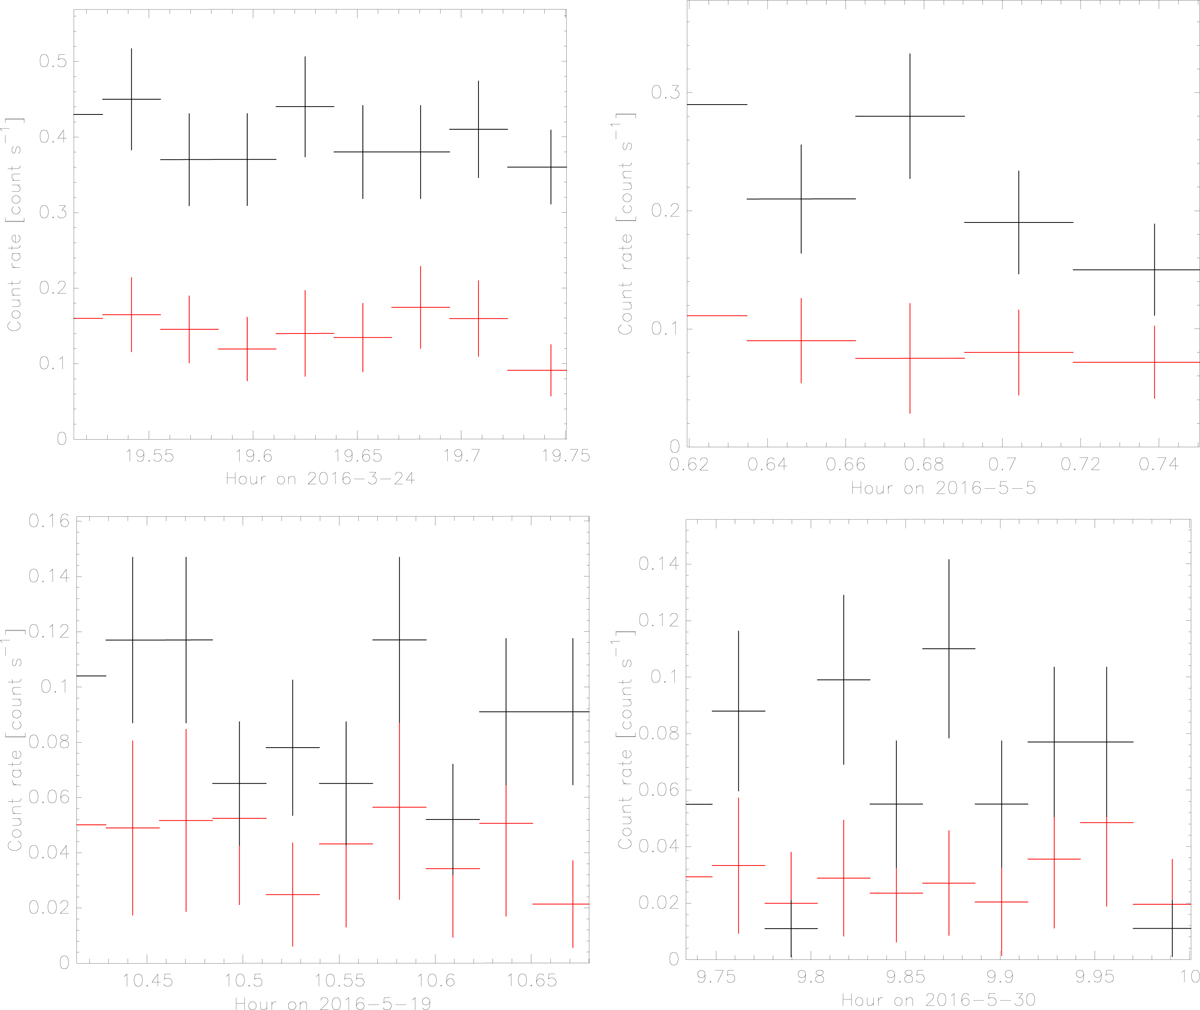
Light curves with a time bin of 100 s as observed by Swift during the active phase of the two transients. The black lines show the Sgr A* count rate, while the red lines represent the average light curve of the PSF tail of the two transients at the same distance as Sgr A*. The vertical bars are the 1σ error bars.
Current usage metrics show cumulative count of Article Views (full-text article views including HTML views, PDF and ePub downloads, according to the available data) and Abstracts Views on Vision4Press platform.
Data correspond to usage on the plateform after 2015. The current usage metrics is available 48-96 hours after online publication and is updated daily on week days.
Initial download of the metrics may take a while.