Fig. B.1.
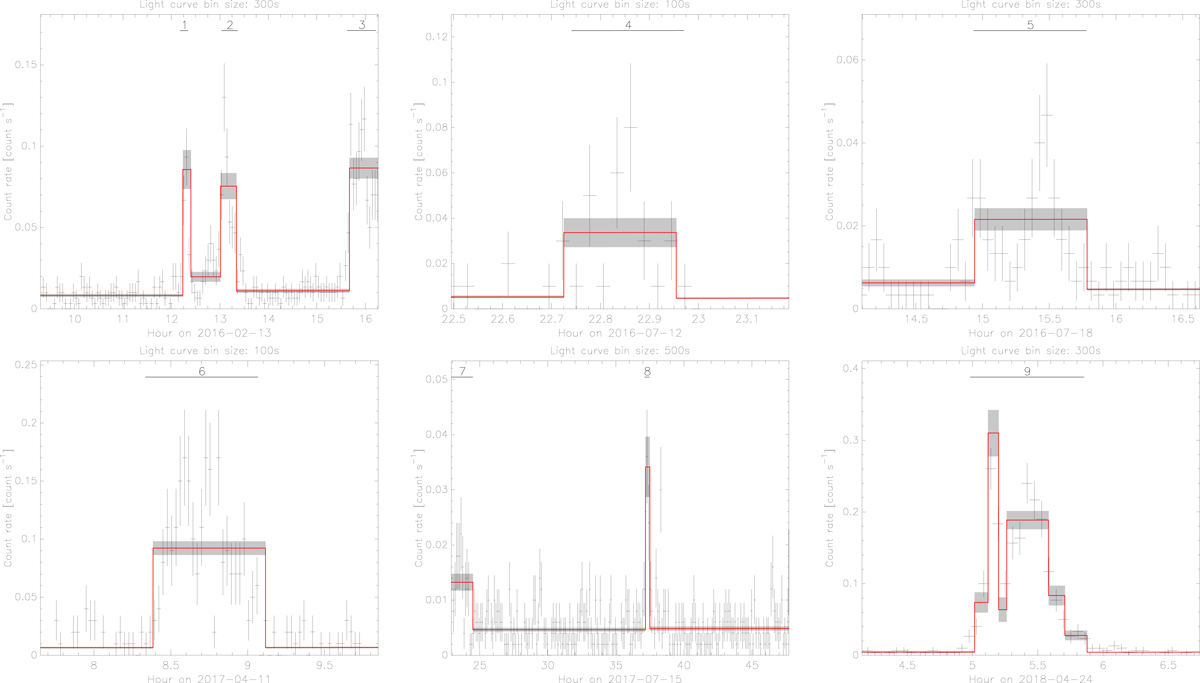
X-ray flares detected using the Bayesian blocks algorithm in 2016–2018. All these flares were observed during Chandra observations. The black crosses are the count rates and their error bars. The bin sizes of the light curves are reported at the top of each figure. The red lines are the Bayesian blocks and their errors are horizontal gray rectangles. Each flare is labeled with the index corresponding to the flare number in Table A.2. The horizontal line is the flare duration.
Current usage metrics show cumulative count of Article Views (full-text article views including HTML views, PDF and ePub downloads, according to the available data) and Abstracts Views on Vision4Press platform.
Data correspond to usage on the plateform after 2015. The current usage metrics is available 48-96 hours after online publication and is updated daily on week days.
Initial download of the metrics may take a while.