Fig. 3.
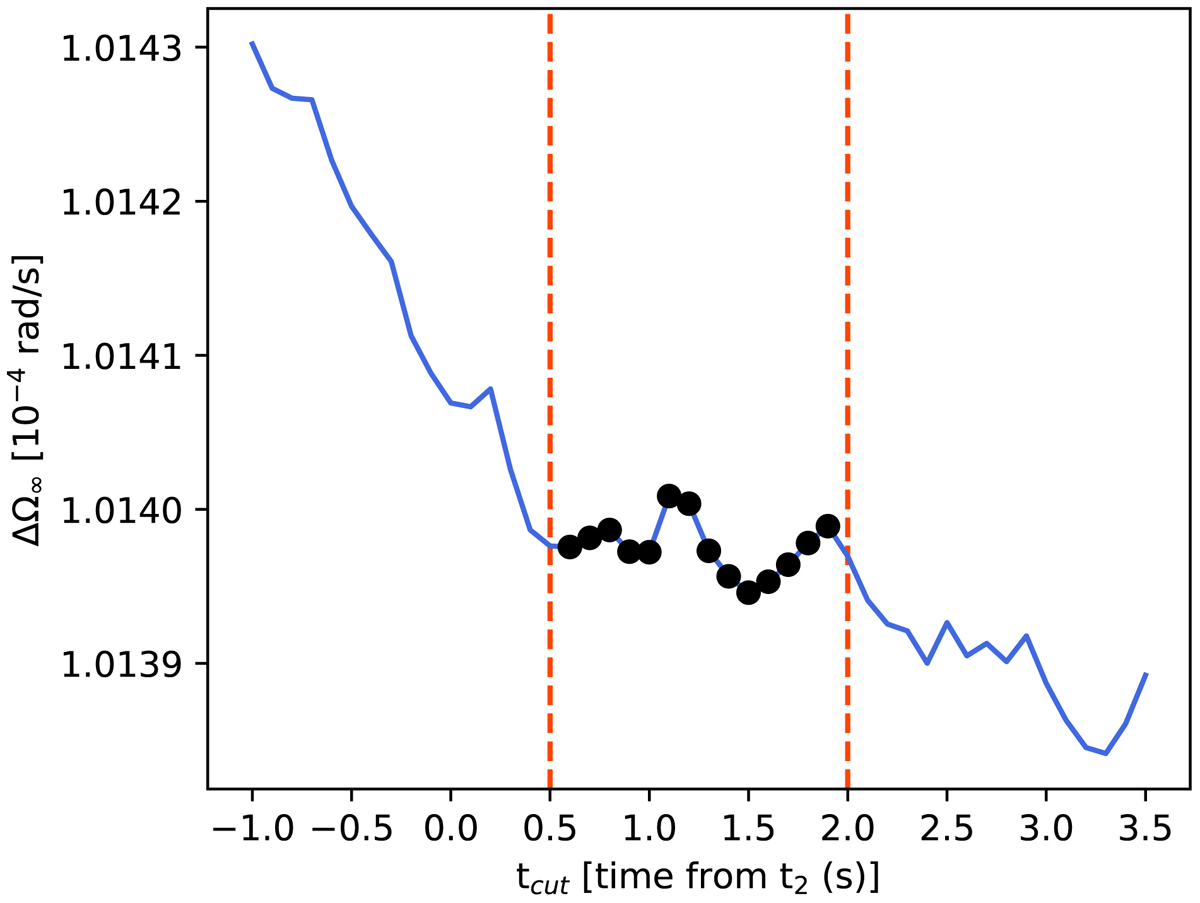
Results of the fit for the parameter ![]() as a function of tcut, the time (measured with respect to t2) before which we neglect the data. We vary tcut by steps of 0.1 s, and connect the results by a line for clarity. Vertical lines define the region we chose to evaluate
as a function of tcut, the time (measured with respect to t2) before which we neglect the data. We vary tcut by steps of 0.1 s, and connect the results by a line for clarity. Vertical lines define the region we chose to evaluate ![]() ; the mean and standard deviations reported in Table 1 are taken for the values of
; the mean and standard deviations reported in Table 1 are taken for the values of ![]() marked by black dots.
marked by black dots.
Current usage metrics show cumulative count of Article Views (full-text article views including HTML views, PDF and ePub downloads, according to the available data) and Abstracts Views on Vision4Press platform.
Data correspond to usage on the plateform after 2015. The current usage metrics is available 48-96 hours after online publication and is updated daily on week days.
Initial download of the metrics may take a while.