Fig. 2.
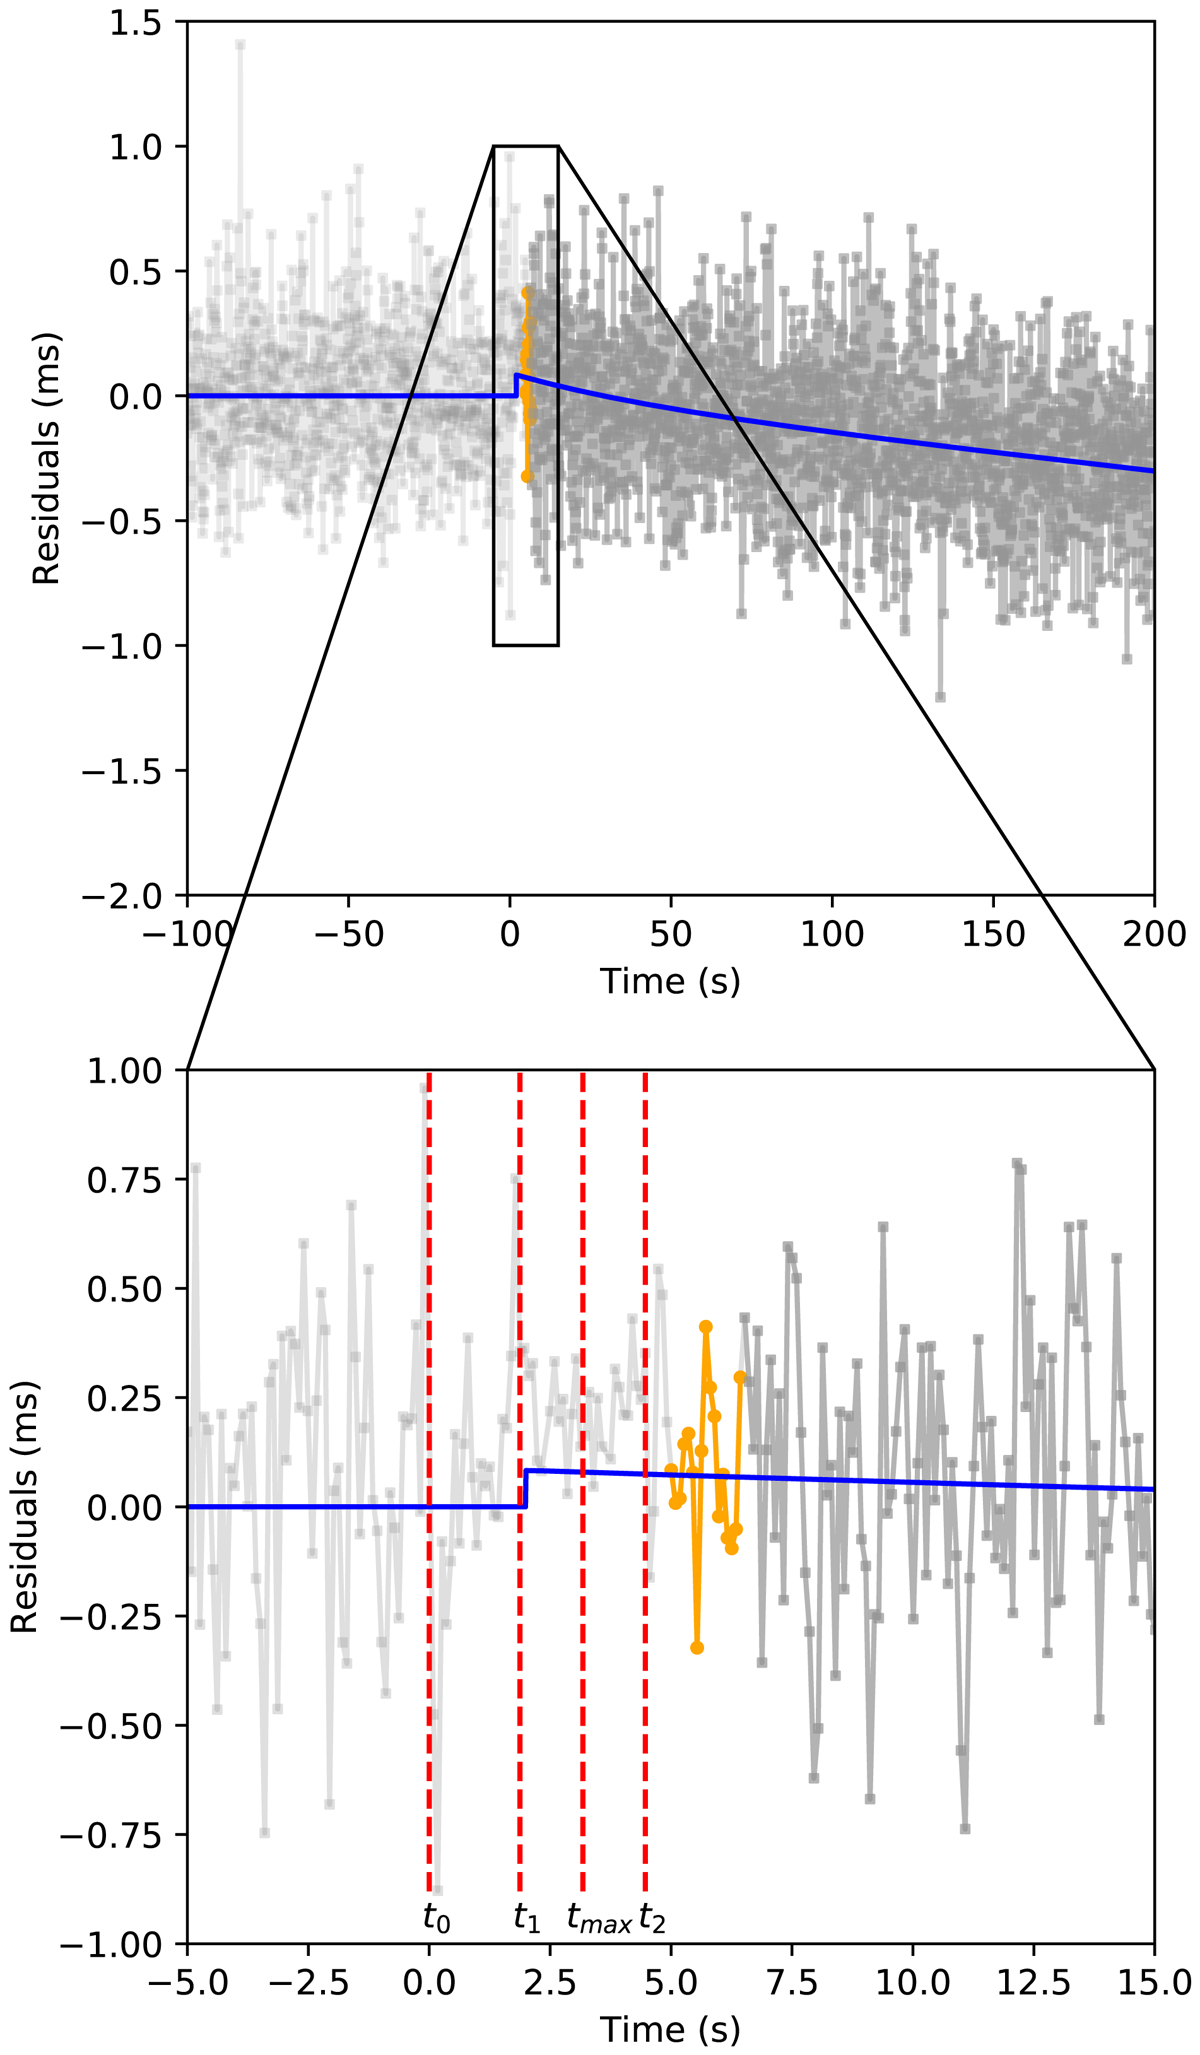
Timing residuals around the time of the glitch, as obtained in Palfreyman et al. (2018). Superimposed in blue, we plot our best fit for the residuals (Eq. (10) with the parameters of Table 1). In the zoomed-in part, we indicate the times t0, t1, t2 defined in Palfreyman et al. (2018) and our result for tmax (cf. Fig. 4). The glitch begins right after t1. Data points are connected by a line for clarity: in light grey those always omitted from the fit, in dark grey those always included, in orange the region corresponding to the interval of tcut over which we evaluate the parameters of the model, as explained in the text (cf. Fig. 3).
Current usage metrics show cumulative count of Article Views (full-text article views including HTML views, PDF and ePub downloads, according to the available data) and Abstracts Views on Vision4Press platform.
Data correspond to usage on the plateform after 2015. The current usage metrics is available 48-96 hours after online publication and is updated daily on week days.
Initial download of the metrics may take a while.