Fig. 5.
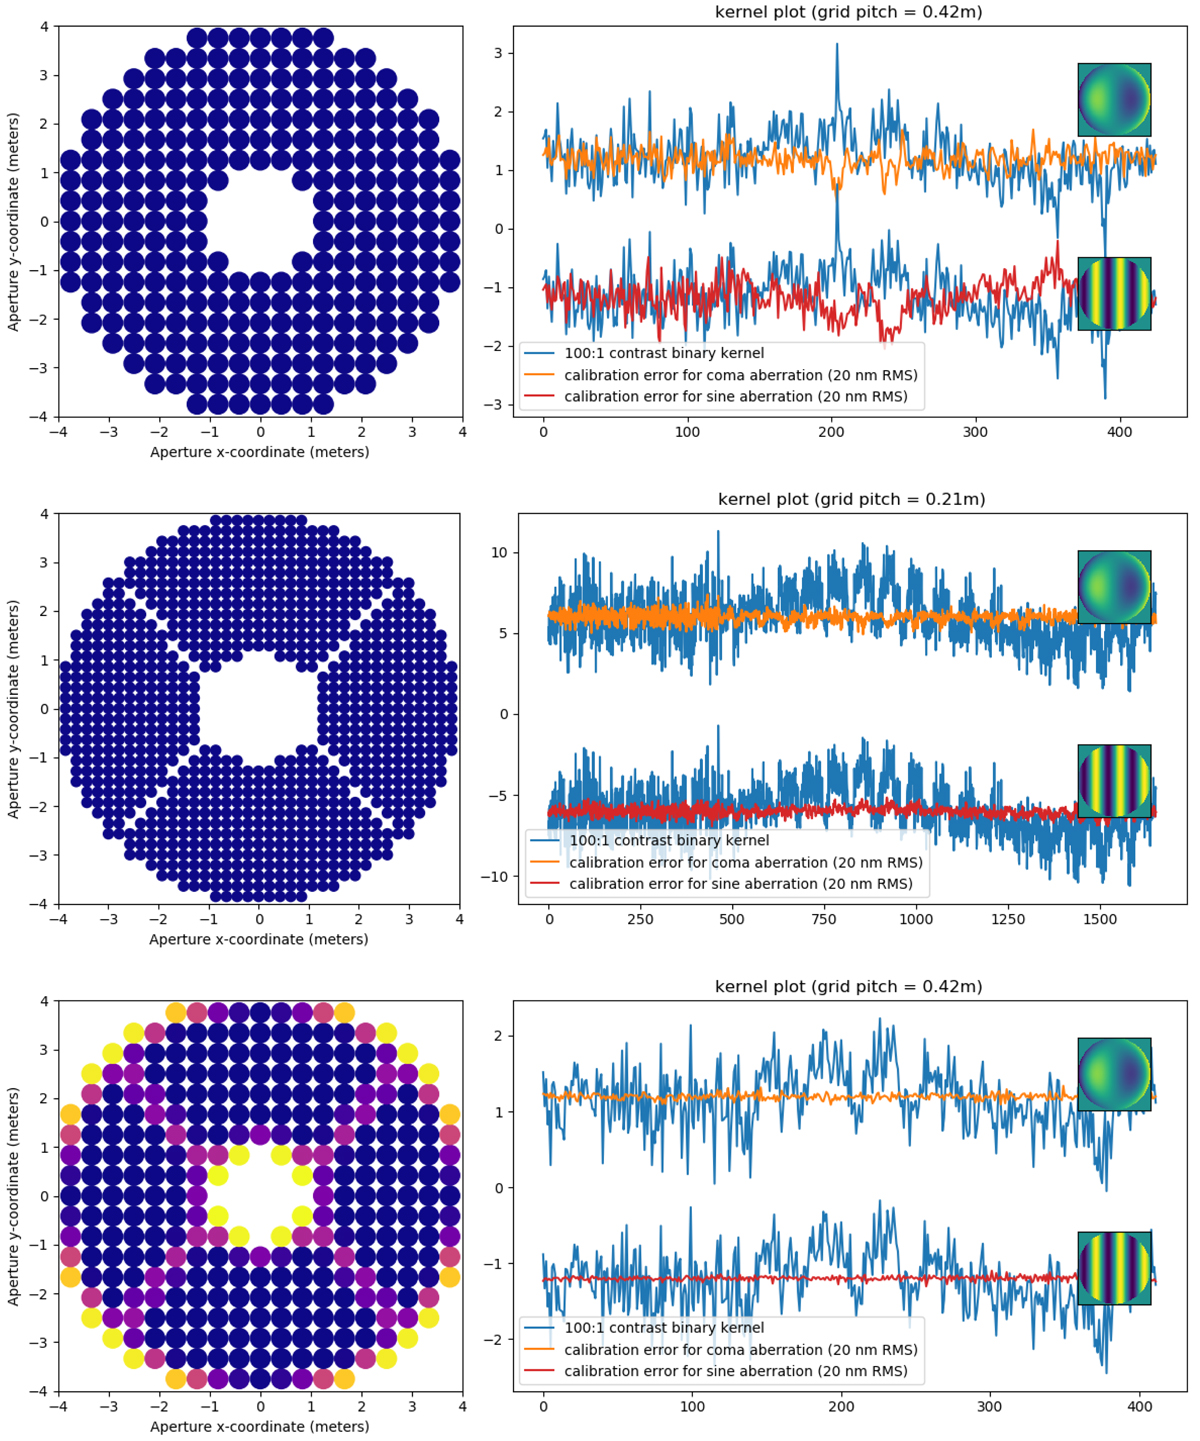
Comparison of the self-calibrating performance of the kernel-phase analysis of a single image for three discrete models of the same aperture. Each of the three panels features, side by side, a 2D representation of the discrete aperture model used and a plot of the kernels extracted from the image of a point source (the calibration error) in the presence of either coma (the orange curve) or a three-cycle sinusoidal aberration (the red curve) and how they compare to the signal of a 100:1 contrast binary (the blue curve). Top panels: reference binary model of the SCExAO pupil, with a 42 cm pitch; middle panel: denser model with a 21 cm pitch that more accurately matches the fine structures of the telescope; third panel: model that uses the original 42 cm pitch grid, but it includes the transmission function.
Current usage metrics show cumulative count of Article Views (full-text article views including HTML views, PDF and ePub downloads, according to the available data) and Abstracts Views on Vision4Press platform.
Data correspond to usage on the plateform after 2015. The current usage metrics is available 48-96 hours after online publication and is updated daily on week days.
Initial download of the metrics may take a while.