Fig. 3.
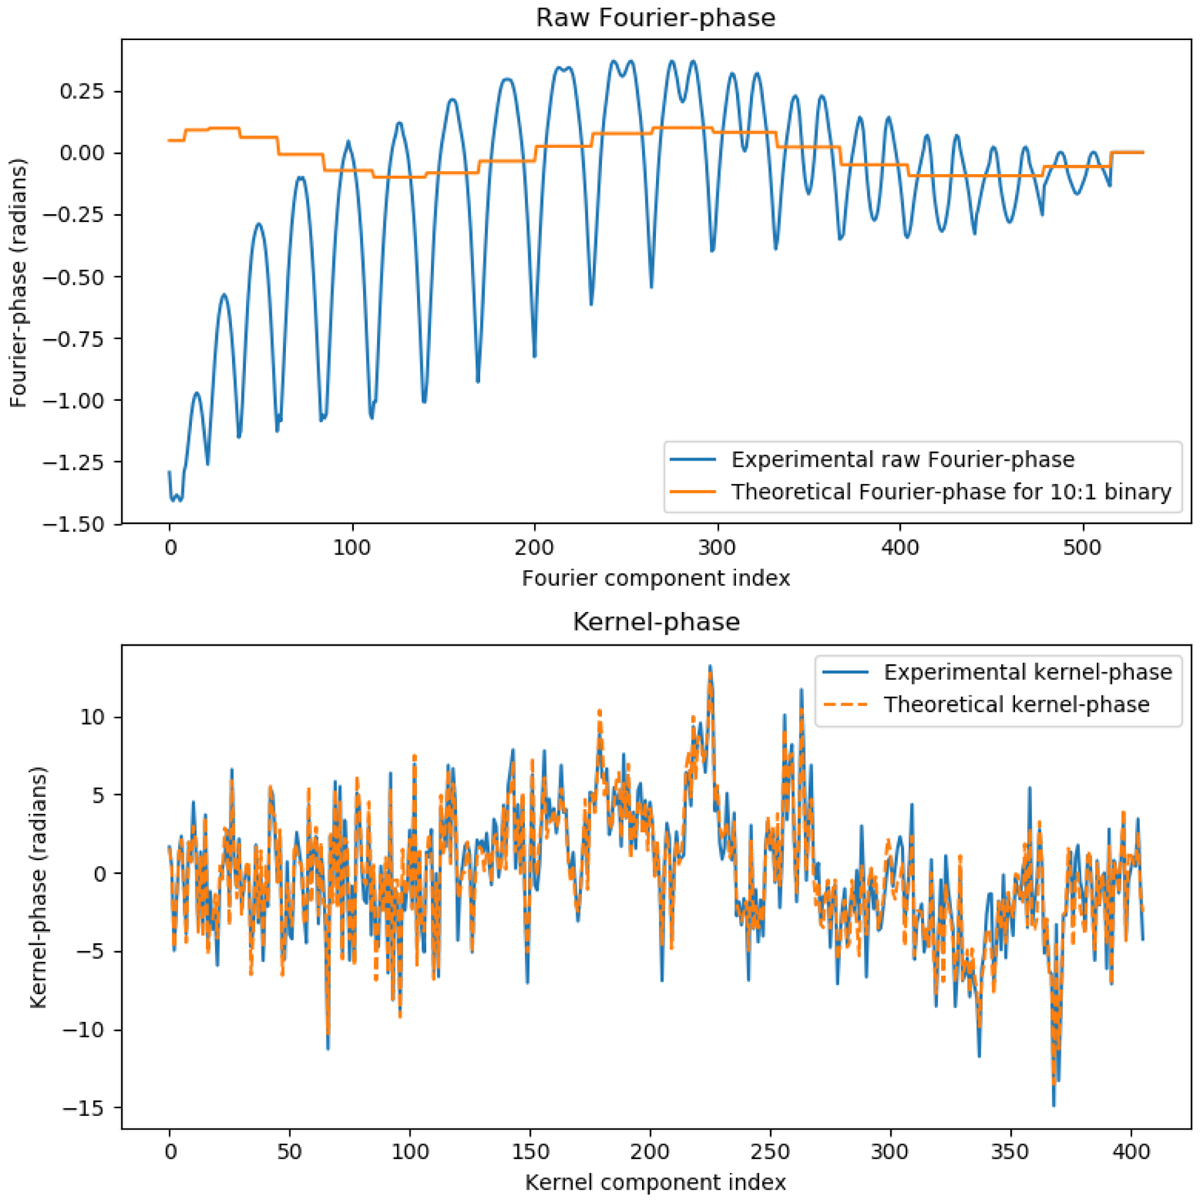
Demonstration of the impact of the kernel processing. Top panel: experimental Fourier phase extracted from a single aberrated image shown in Fig. 2 (the blue curve) bears little ressemblance with the theoretical expected binary signal (in orange). Contrasting with the raw Fourier phase, the bottom panel shows how the projection onto the kernel subspace efficiently erases the impact of the aberration and brings the experimental kernel-phase curve (K ⋅ Φ), which is also plotted with a solid blue line, much closer to its theoretical counterpart (K ⋅ Φ0), which is now plotted with a dashed orange line so as to better distinguish them.
Current usage metrics show cumulative count of Article Views (full-text article views including HTML views, PDF and ePub downloads, according to the available data) and Abstracts Views on Vision4Press platform.
Data correspond to usage on the plateform after 2015. The current usage metrics is available 48-96 hours after online publication and is updated daily on week days.
Initial download of the metrics may take a while.