Fig. 9.
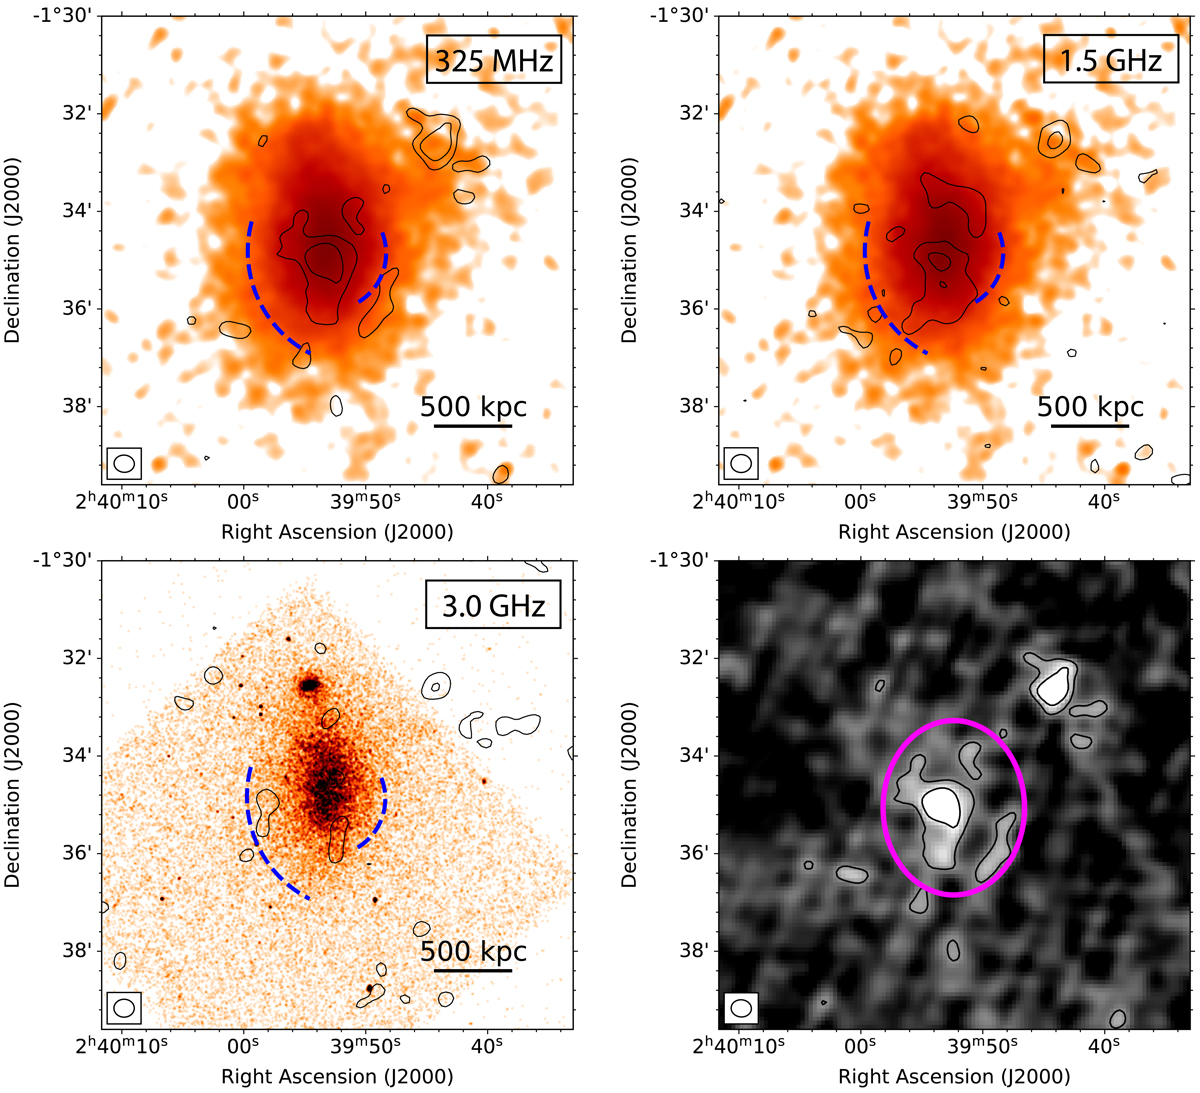
XMM-Newton 0.3–7 keV image of A370 overlaid with the radio contours with compact sources subtracted from the uv-data (325 MHz, top left; 1.5 GHz, top right). All the point source in XMM-Newton image are removed and smoothed with a Gaussian with scale of 3 pixels across. The Blue dashed curves show the surface brightness edges found by Botteon et al. (2018). Bottom left: Chandra 0.5–2.0 keV image overlaid with the 3.0 GHz radio contours with compact sources subtracted from the uv-data. The radio beam size is 25.0″ × 22.0″. Contour levels are drawn at [1, 2, 4, 8,...] × 3σrms, where σ325 MHz = 161 μJy beam−1, σ1.5 GHz = 34 μJy beam−1, σ3.0 GHz = 18 μJy beam−1. The inner uv-cut of 0.22 kλ is adopted for 325 MHz and 1.5 GHz images. Bottom right: GMRT 325 MHz image of A370 depicting the region (magenta ellipse) where we extract the integrated flux densities.
Current usage metrics show cumulative count of Article Views (full-text article views including HTML views, PDF and ePub downloads, according to the available data) and Abstracts Views on Vision4Press platform.
Data correspond to usage on the plateform after 2015. The current usage metrics is available 48-96 hours after online publication and is updated daily on week days.
Initial download of the metrics may take a while.