Fig. 6.
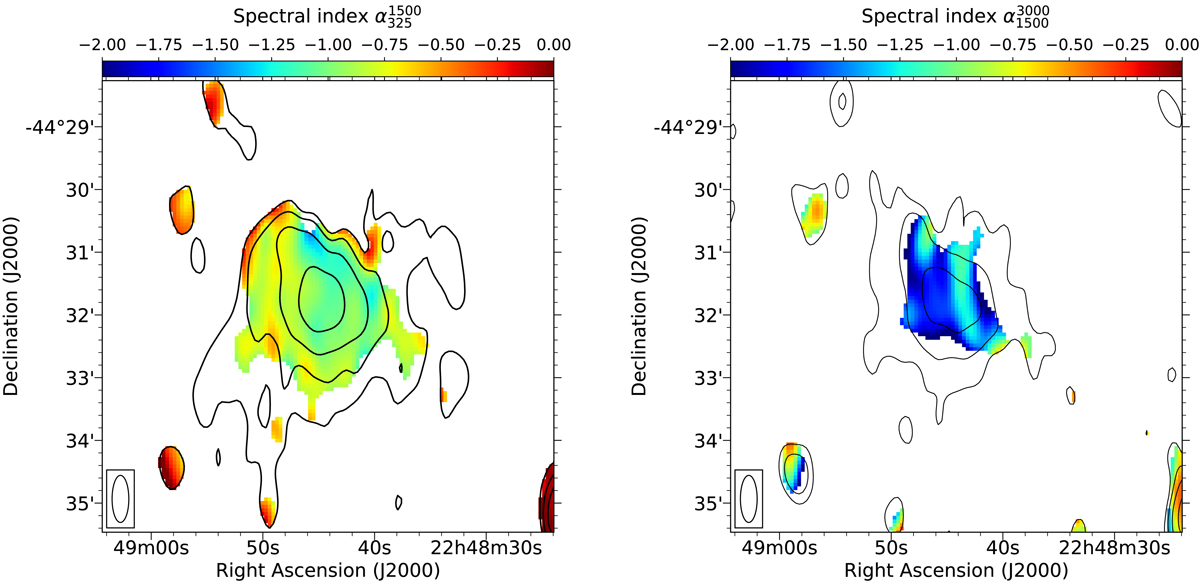
Spectral index maps of AS1063 between 325 MHz and 1.5 GHz (left), and between 1.5 GHz and 3.0 GHz (right). The radio contours are from the 325 MHz (left) and 1.5 GHz (right) images. These maps were created from the compact source subtracted uv-data. The beam size is indicated in the bottom left corner. Contour levels are drawn at [1, 2, 4, 8, ...] × 3σrms, where σ325 MHz = 96 μJy beam−1, σ1.5 GHz = 40 μJy beam−1.
Current usage metrics show cumulative count of Article Views (full-text article views including HTML views, PDF and ePub downloads, according to the available data) and Abstracts Views on Vision4Press platform.
Data correspond to usage on the plateform after 2015. The current usage metrics is available 48-96 hours after online publication and is updated daily on week days.
Initial download of the metrics may take a while.